Median Age
43 Years
Largest Age Group
45-54 Years
Approximately 15% of Residents
Under 20
25%
Over 65
19%

Area Guide
Avg Rent
$3,077
Population
26,134
Renter Mix
38% Rent
Sitting just eight miles west of Downtown Boston, Belmont has earned its local nickname — "the Town of Homes" — through decades of well-kept residential streets and a close-knit atmosphere that larger cities rarely replicate. Incorporated in 1859 from portions of Watertown, Waltham, and Arlington, this compact Middlesex County town covers just five square miles yet packs in a surprisingly layered sense of place. Its position on Cambridge's western border puts Harvard Square within easy reach, and the broader Greater Boston employment and academic corridors are genuinely convenient for daily commuters.
Belmont's housing stock reflects its deep-rooted residential character. Historic single-family homes anchor neighborhoods like the Pleasant Street Historic District, while apartment communities range from converted multi-family buildings with classic New England architecture to updated rental options suited for a range of lifestyles. The mix gives renters a chance to settle into a quieter, tree-lined setting without sacrificing access to one of the country's most dynamic metro areas.
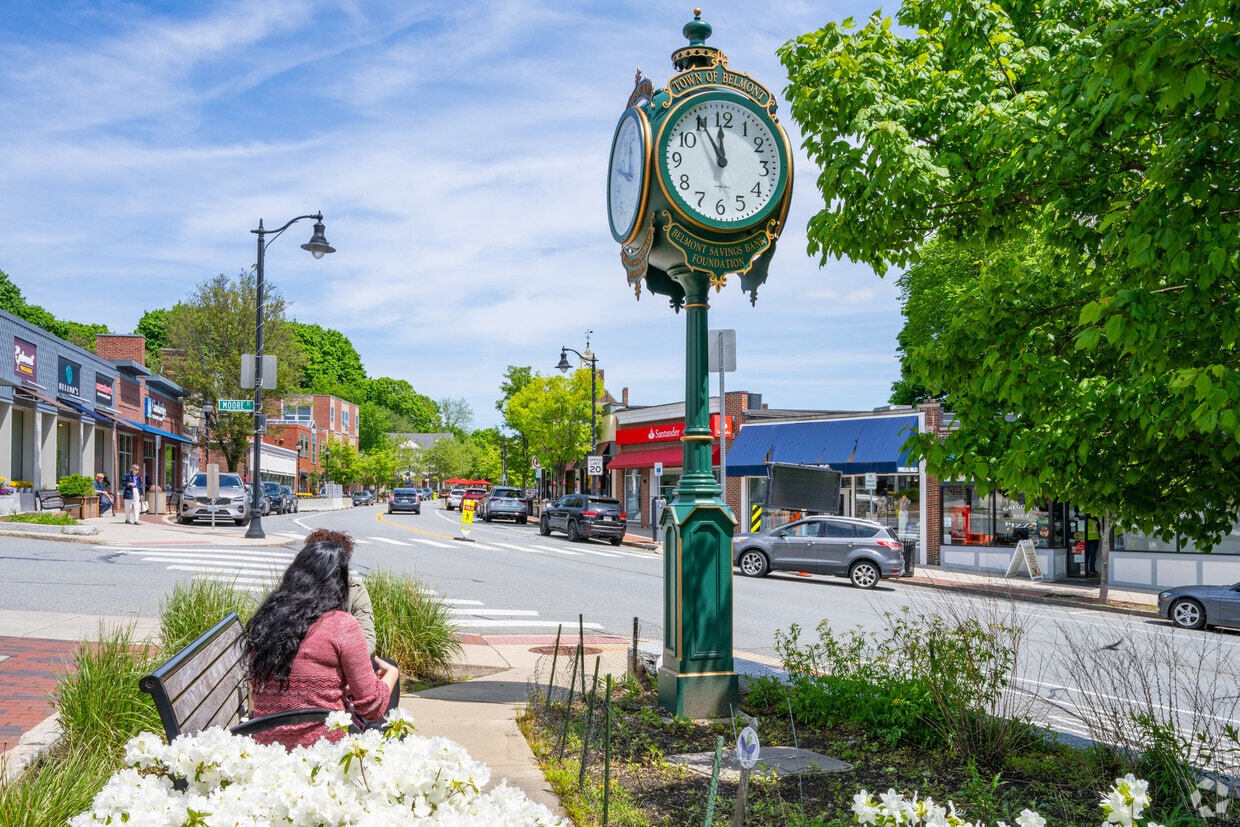
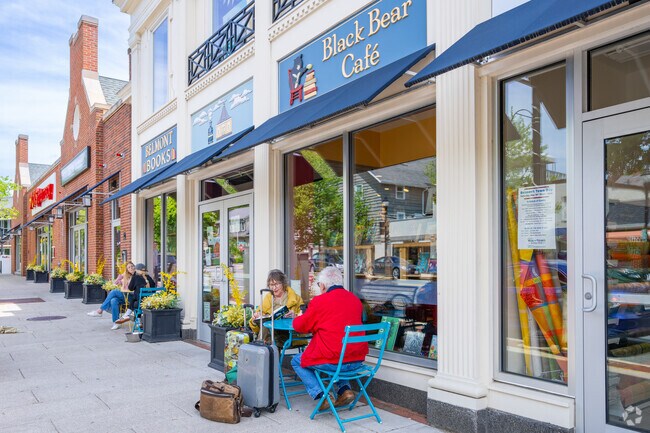
The town's commercial heart along Leonard Street adds a grounded, neighborhood-scale energy to everyday life. Belmont's founders originally envisioned it as a dry township — a distinction that shaped its early character — and that thoughtful, intentional spirit still feels present in how the community has grown and preserved itself over the years.
Stop by Il Casale in Belmont Hill for delicious Italian cuisine.
Warrendale offers access to everything with a suburban, small-town feel.
Belmont Center has many local businesses offering outdoor seating along Leonard St.
Gambrel colonial-style homes are popular in Belmont Center.
Enjoy sitting among the greenery at Alewife Brook Reservation near Belmont Center.
Pick up your weekly groceries at the Belmont Farmers Market.
Median Household Income
$162,307
Average: $181,105
Education
14,748
Residents Have a Degree
Job Market
13,873
Workers Employed
Median Age
43 Years
Largest Age Group
45-54 Years
Approximately 15% of Residents
Under 20
25%
Over 65
19%
Housing Distribution
Belmont has more homeowners than renters.

Education Distribution
Review this city's overall education levels.

As of July 2026, the average apartment rent in Belmont, MA is $2,937 for a studio, $3,079 for one bedroom, $3,940 for two bedrooms, and $4,545 for three bedrooms. Apartment rent in Belmont has decreased by -1.6% in the past year.
Explore how walkable, bikeable, drivable, and transit-friendly Belmont, MA is for everyday living.
Fairly Walkable
Walkability
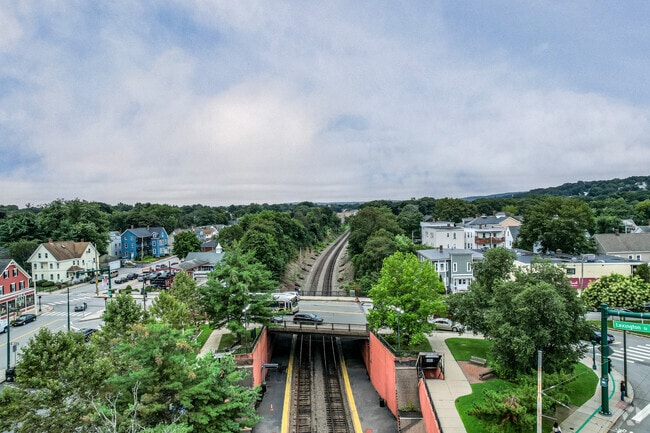
Some Public Transit
Transit
Exceptionally Drivable
Drivability
Fairly Bikeable
Bikeability
Public
Grades K-5
280 Students

Public
Grades K-5
258 Students
Public
Grades K-5
254 Students
Roger Wellington Elementary School
Public
Grades PK-5
388 Students

Public
Grades K-8
1,028 Students

Winthrop L Chenery Middle School
Public
Grades K-8
1,028 Students
Public
Grades K-8
1,028 Students
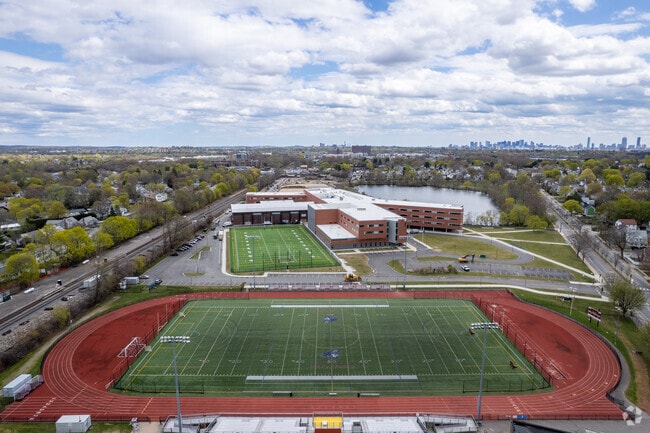
Public
Grades 9-12
1,498 Students
Public
Grades 9-12
1,498 Students
† Our analysis of utilities, groceries, transportation, healthcare, home prices, and other goods and services is sourced from the Cost of Living Index, a respected benchmark published by the Council for Community and Economic Research (C2ER) that provides a thorough overview of living expenses across different regions.
Rent data is provided by CoStar Group’s Market Trend reports. As the industry leader in commercial real estate information, analytics, and news, CoStar conducts extensive research to produce and maintain a comprehensive database of commercial real estate information. We combine this data with public record to provide the most up-to-date rental information available.
Consumer goods, services, and home prices are sourced from the Cost of Living Index published by the Council for Community and Economic Research (C2ER). The data on this page is updated quarterly. It was last published in June 2026.
Demographic information comes from Neustar and combines detailed address data with U.S. Census and American Community Survey statistics to produce reliable local estimates.


