Median Age
43 Years
Largest Age Group
40-49 Years
Approximately 16% of Residents
Under 20
23%
Over 65
19%

Avg Rent
$2,404
Population
45,036
Renter Mix
40% Rent
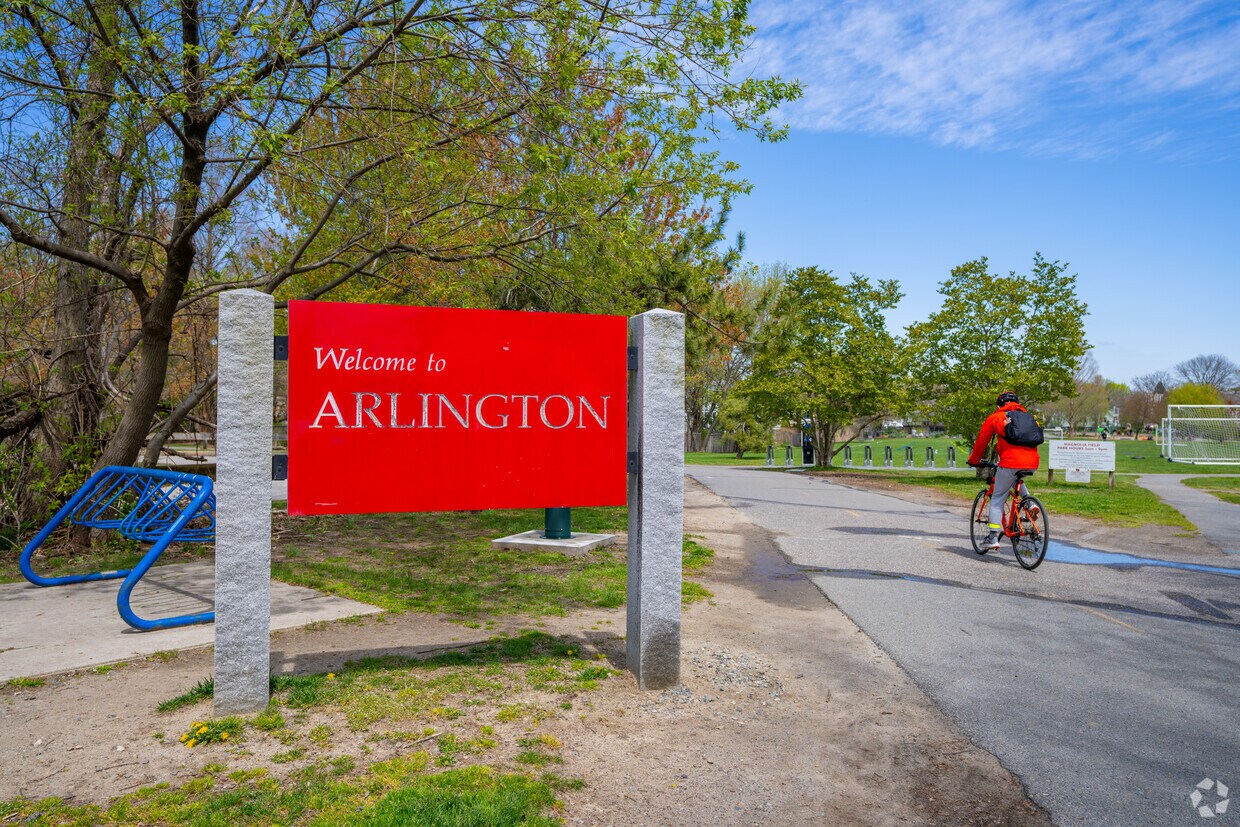
Sitting roughly six miles from downtown Boston, Arlington is arguably one of the best options in the area for families. The town boasts excellent schools and one of the lowest crime rates in the region. The community is very conducive to bicycling, with the Minuteman Bikeway connecting several of the town’s neighborhoods and many of the busier roadways incorporating dedicated bike lanes.
Nowhere in town is very far from a public park or a golf course, making outdoor recreation highly accessible from anywhere you may choose to rent. Just outside of town, attractions like the Middlesex Fells Reservation, Stone Zoo, and Walden Pond State Reservation offer more good reasons to get outside. To the south, the Concord Turnpike connects Arlington to I-95, making it easy to get anywhere you need to go.
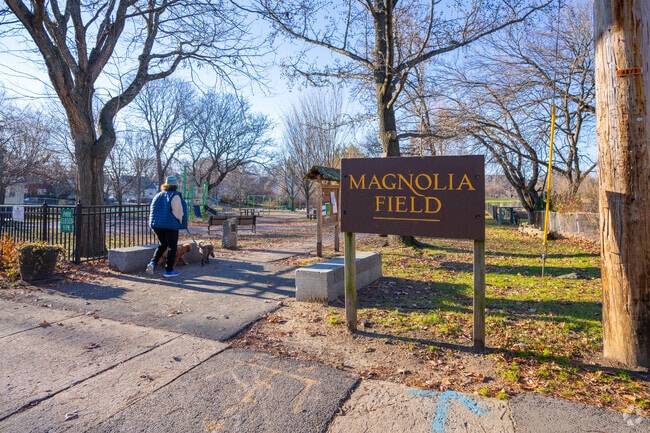
Take a walk through Magnolia Park.
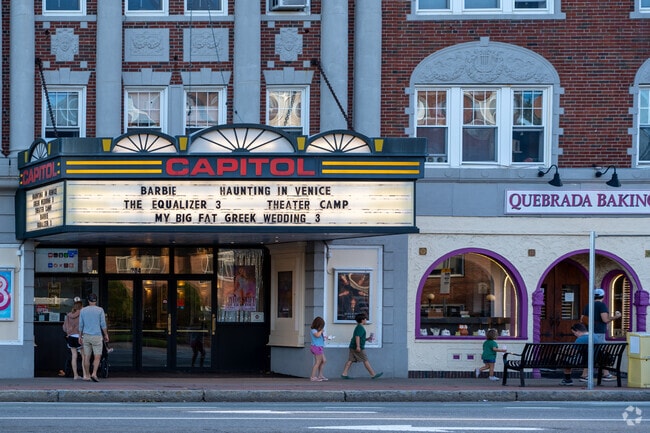
Enjoy a show at the Capitol Theatre.
Median Household Income
$134,753
Average: $162,010
Education
25,998
Residents Have a Degree
Job Market
26,290
Workers Employed
Median Age
43 Years
Largest Age Group
40-49 Years
Approximately 16% of Residents
Under 20
23%
Over 65
19%
Housing Distribution
Arlington has more homeowners than renters.

Education Distribution
Review this city's overall education levels.

As of July 2026, the average apartment rent in Arlington, MA is $2,055 for a studio, $2,404 for one bedroom, $3,497 for two bedrooms, and $5,093 for three bedrooms. Apartment rent in Arlington has increased by 1.6% in the past year.
Explore how walkable, bikeable, drivable, and transit-friendly Arlington, MA is for everyday living.
Moderately Walkable
Walkability
Some Public Transit
Transit
Moderately Drivable
Drivability
Moderately Bikeable
Bikeability
Public
Grades K-5
376 Students

Public
Grades K-5
373 Students
Public
Grades K-5
516 Students

Public
Grades K-8
480 Students
M. Norcross Stratton Elementary School
Public
Grades K-5
423 Students
Public
Grades 6-8
977 Students
Public
Grades 6-8
977 Students
Public
Grades K-8
480 Students
Public
Grades 9-12
1,757 Students

Public
Grades 9-12
1,757 Students
† Our analysis of utilities, groceries, transportation, healthcare, home prices, and other goods and services is sourced from the Cost of Living Index, a respected benchmark published by the Council for Community and Economic Research (C2ER) that provides a thorough overview of living expenses across different regions.
Rent data is provided by CoStar Group’s Market Trend reports. As the industry leader in commercial real estate information, analytics, and news, CoStar conducts extensive research to produce and maintain a comprehensive database of commercial real estate information. We combine this data with public record to provide the most up-to-date rental information available.
Consumer goods, services, and home prices are sourced from the Cost of Living Index published by the Council for Community and Economic Research (C2ER). The data on this page is updated quarterly. It was last published in June 2026.
Demographic information comes from Neustar and combines detailed address data with U.S. Census and American Community Survey statistics to produce reliable local estimates.


