
Five Most Affordable Neighborhoods in Boston, MA
Searching for housing on a budget in Boston? Explore the most affordable areas in the city with this in-depth guide.


Avg Rent
$3,621
Population
639,172
Renter Mix
69% Rent
Boston has been shaping American history since 1630, and living here means that past is never far from the present. As Massachusetts' capital and New England's cultural and financial center, the city carries real weight — intellectually, economically, and architecturally. More than 50 colleges and universities call the greater Boston area home, with institutions like Northeastern, Boston College, and Berklee College of Music woven directly into the city's neighborhoods. That academic presence fuels a steady demand for innovation, drawing employers in life sciences, technology, finance, and healthcare.
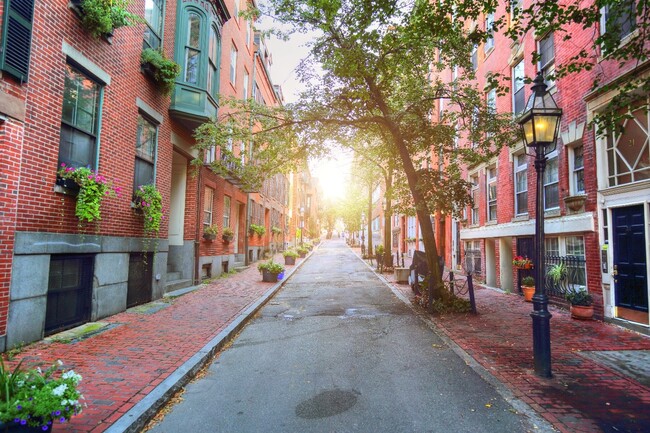
Neighborhoods here each carry a distinct personality. Beacon Hill delivers narrow gas-lit streets and Greek Revival rowhouses, while Back Bay is known for Victorian brownstones and the broad sweep of Commonwealth Avenue. The South End offers brick sidewalks and art galleries along Tremont Street, and the Seaport District brings waterfront views alongside the Institute of Contemporary Art. Charlestown holds the Bunker Hill Monument and the Navy Yard, while Jamaica Plain borders the green expanse of Jamaica Pond.
The rental market spans a wide range of options, from classic triple-deckers converted into apartments, to sleek high-rise apartment communities in the Seaport, to historic brownstone units in Back Bay. Compact studios near transit lines sit alongside spacious multi-bedroom townhomes in quieter residential pockets, giving renters genuine variety across one of the country's most storied cities.
Quincy Market's Upper Rotunda
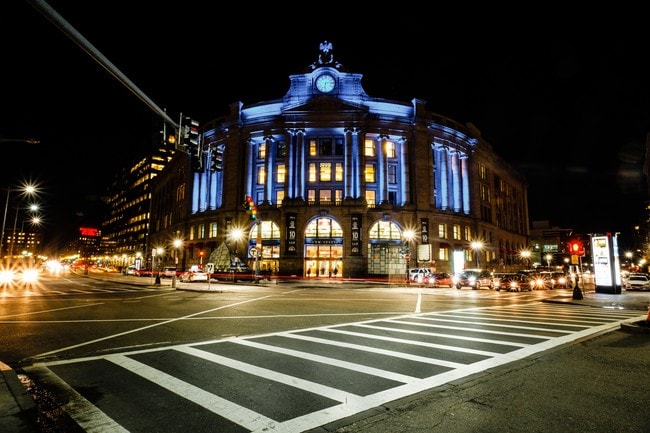
South Station's evening lights
The historic Old State House
Sailboats in Boston Harbor
Boston's historic Fenway Park
The USS Constitution Museum is located at the Boston Navy Yard
Median Household Income
$84,197
Average: $115,426
Education
281,603
Residents Have a Degree
Job Market
358,410
Workers Employed
Median Age
35 Years
Largest Age Group
25-34 Years
Approximately 21% of Residents
Under 20
21%
Over 65
14%
Housing Distribution
Boston has more renters than homeowners.

Education Distribution
Review this city's overall education levels.

As of August 2026, the average apartment rent in Boston, MA is $2,975 for a studio, $3,621 for one bedroom, $4,570 for two bedrooms, and $5,946 for three bedrooms. Apartment rent in Boston has increased by 4.0% in the past year.
The cost of living in Boston, MA is 48.3% higher than the national average. Generally, housing in Boston is 120.6% more expensive than the national average, with rent falling between $2,975 - $5,946. You can expect to pay 3.9% more for groceries, 51.3% more for utilities, and 5.4% more for transportation.
Compare Cities

Five Most Affordable Neighborhoods in Boston, MA
Searching for housing on a budget in Boston? Explore the most affordable areas in the city with this in-depth guide.

Best Boston Neighborhoods for College Students Based on T-Stops and Rent Trends
Finding an affordable rental close to campus is crucial for college students. Neighborhoods near T-stops are perfect since they offer both affordability and convenient access to public transportation. However, these features aren’t exclusive to students. If you’re searching for an affordable neighborhood in Boston that’s walkable and near a train station, check out these great areas.
The Best of One-Bedroom Apartments in Boston
Should you rent a one-bedroom apartment in Boston? Here are some things to consider.

7 Best Places to Live in Massachusetts
Open to exploring your options? Discover other great cities in Massachusetts with our detailed guide.

10 Best Places to Celebrate St. Patrick's Day in the U.S.
Big fan of St. Patrick's Day? Live somewhere that shares your passion! Here's a list of 10 cities that turn into Ireland every March 17.

Best Neighborhoods in Boston for Renters
Don’t know where to start your Boston rental search? Here are five Boston neighborhoods perfect for renters.
Explore how walkable, bikeable, drivable, and transit-friendly Boston, MA is for everyday living.
Exceptionally Walkable
Walkability
Good Public Transit
Transit
Moderately Drivable
Drivability
Moderately Bikeable
Bikeability
Public
Grades PK-5
295 Students

Public
Grades PK-5
100 Students
Public
Grades K-12
2,230 Students

Public
Grades PK-8
779 Students
Public
Grades PK-8
544 Students
Public
Grades 6-12
2,382 Students
Public
Grades K-12
2,230 Students
Public
Grades 6-12
1,518 Students
Public
Grades PK-8
779 Students
Public
Grades PK-8
544 Students
Public
Grades 6-12
2,382 Students
Public
Grades K-12
2,230 Students
Public
Grades 6-12
1,518 Students
Public
Grades 6-12
1,669 Students

Public
Grades K-12
1,376 Students
† Our analysis of utilities, groceries, transportation, healthcare, home prices, and other goods and services is sourced from the Cost of Living Index, a respected benchmark published by the Council for Community and Economic Research (C2ER) that provides a thorough overview of living expenses across different regions.
Rent data is provided by CoStar Group’s Market Trend reports. As the industry leader in commercial real estate information, analytics, and news, CoStar conducts extensive research to produce and maintain a comprehensive database of commercial real estate information. We combine this data with public record to provide the most up-to-date rental information available.
Consumer goods, services, and home prices are sourced from the Cost of Living Index published by the Council for Community and Economic Research (C2ER). The data on this page is updated quarterly. It was last published in June 2026.
Demographic information comes from Neustar and combines detailed address data with U.S. Census and American Community Survey statistics to produce reliable local estimates.


