Median Age
35 Years
Largest Age Group
30-39 Years
Approximately 28% of Residents
Under 20
19%
Over 65
11%




Avg Rent
$3,230
Population
36,103
Renter Mix
62% Rent
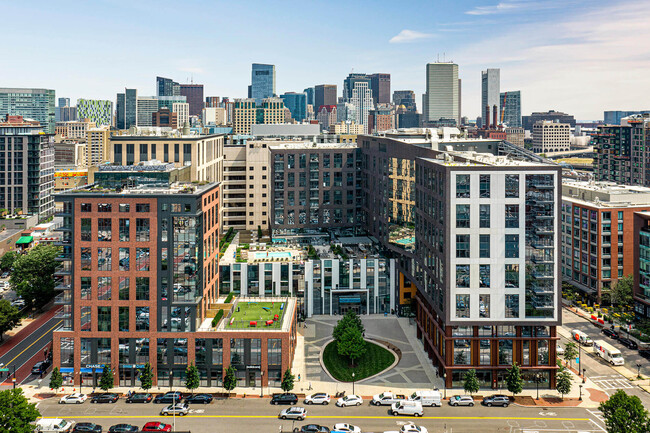
Welcome to South Boston, affectionately known as "Southie," where historic charm meets city living. This waterfront neighborhood, situated along Dorchester Bay, combines coastal amenities with urban convenience. Current rental trends show diverse options, with one-bedroom apartments averaging $3,113, while two-bedrooms command approximately $3,803 monthly. The area's housing market remains competitive, though some segments have seen modest adjustments, with studio apartments experiencing a 12.2% decrease in rent year-over-year, while three-bedroom units have enjoyed a 9.8% increase.
The neighborhood's three-mile stretch of parkland and beaches, including Carson Beach and Pleasure Bay, offers opportunities for morning jogs or sunset strolls. Castle Island, home to historic Fort Independence, provides 22 acres of recreational space and harbor views. The area features attractions like the Institute of Contemporary Art in the Seaport District and hosts the annual St. Patrick's Day Parade, a celebrated tradition drawing nearly one million spectators. South Boston's evolution has welcomed new restaurants and boutiques in the Seaport area, while established local spots maintain the neighborhood's authentic character. The area includes City Point's distinctive brownstones and offers easy access to Carson Beach and numerous public parks.
Fort Independence on Castle Island
South Boston's stunning bay
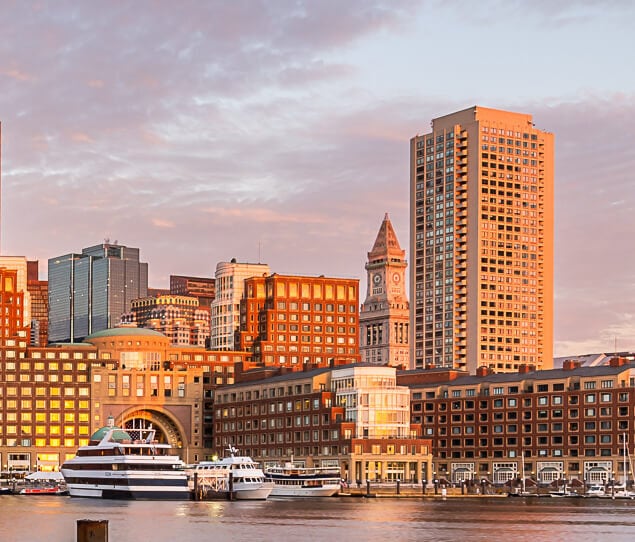
The beautiful Boston waterfront during sunset
Median Household Income
$136,031
Average: $161,535
Education
20,311
Residents Have a Degree
Job Market
23,961
Workers Employed
Median Age
35 Years
Largest Age Group
30-39 Years
Approximately 28% of Residents
Under 20
19%
Over 65
11%
Housing Distribution
South Boston has more renters than homeowners.

Education Distribution
Review this city's overall education levels.

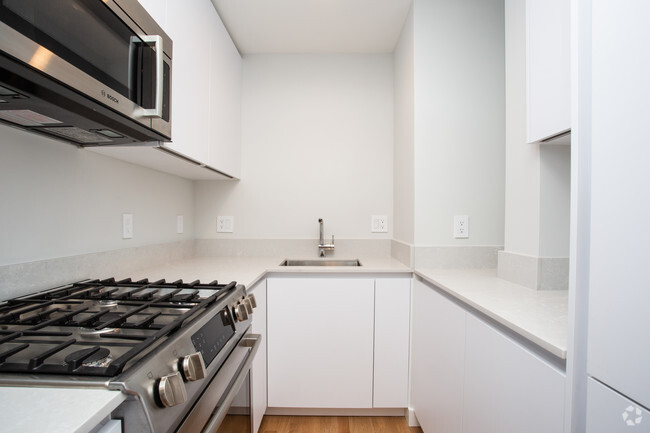
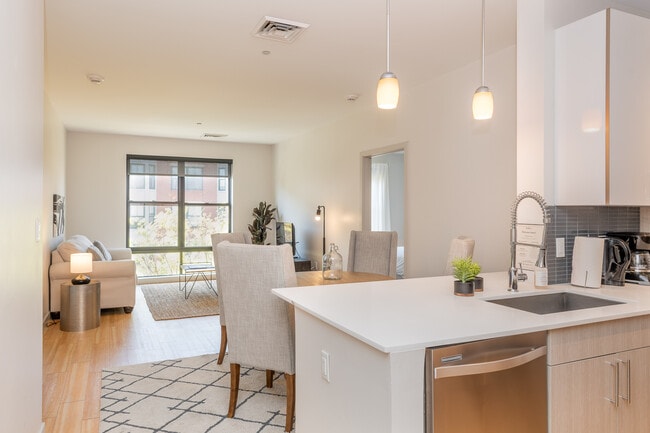
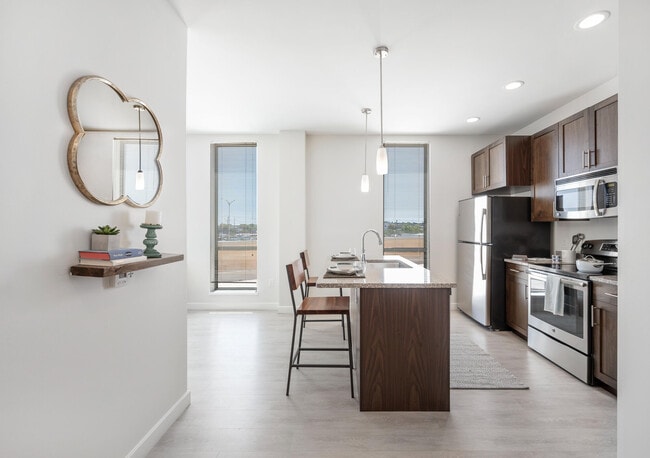
As of August 2026, the average apartment rent in South Boston, MA is $2,892 for a studio, $3,266 for one bedroom, $4,126 for two bedrooms, and $3,053 for three bedrooms. Apartment rent in South Boston has decreased by -0.5% in the past year.
Explore how walkable, bikeable, drivable, and transit-friendly South Boston, MA is for everyday living.
Exceptionally Walkable
Walkability
Strong Public Transit
Transit
Somewhat Drivable
Drivability
Moderately Bikeable
Bikeability

† Our analysis of utilities, groceries, transportation, healthcare, home prices, and other goods and services is sourced from the Cost of Living Index, a respected benchmark published by the Council for Community and Economic Research (C2ER) that provides a thorough overview of living expenses across different regions.
Rent data is provided by CoStar Group’s Market Trend reports. As the industry leader in commercial real estate information, analytics, and news, CoStar conducts extensive research to produce and maintain a comprehensive database of commercial real estate information. We combine this data with public record to provide the most up-to-date rental information available.
Consumer goods, services, and home prices are sourced from the Cost of Living Index published by the Council for Community and Economic Research (C2ER). The data on this page is updated quarterly. It was last published in June 2026.
Demographic information comes from Neustar and combines detailed address data with U.S. Census and American Community Survey statistics to produce reliable local estimates.