Median Age
38 Years
Largest Age Group
30-39 Years
Approximately 20% of Residents
Under 20
19%
Over 65
17%

Avg Rent
$3,048
Population
57,217
Renter Mix
49% Rent
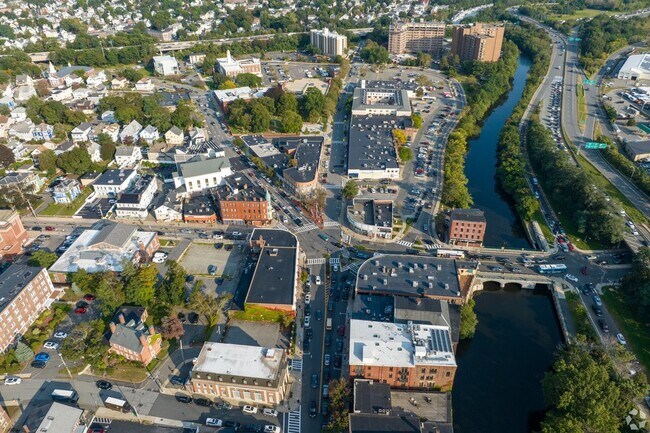
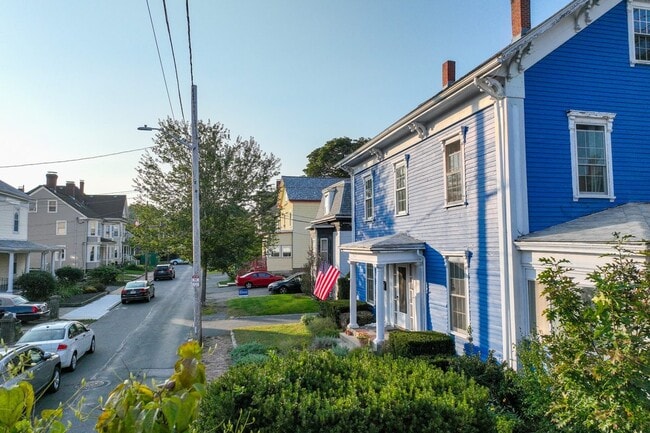
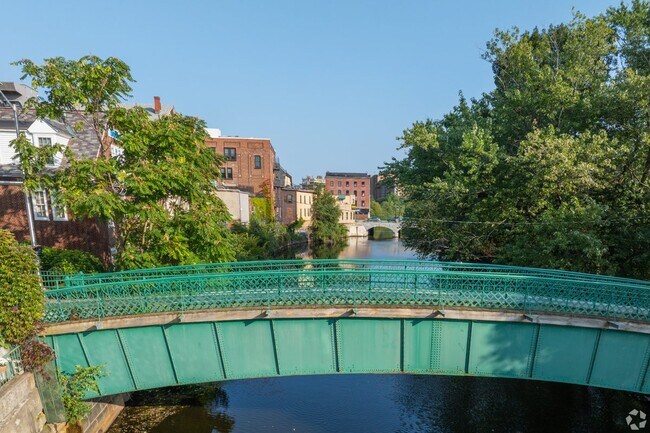
Welcome to Medford, located six miles northwest of Boston along the Mystic River. This established community offers varied housing options, from historic properties in West Medford to newer apartment communities near Wellington Station. The rental market remains competitive, with current average rents ranging from $2,599 for studios to $4,081 for three-bedroom units, reflecting a mix of year-over-year changes across different unit sizes. The Medford Hillside area houses Tufts University's campus, while the Middlesex Fells Reservation provides over 2,000 acres of trails and natural space.
Medford's history as a shipbuilding center adds character to this riverside community. Notable landmarks include the Royall House and Slave Quarters, a significant historical site preserving an important piece of Massachusetts history. The city's neighborhoods showcase distinct architectural styles and local traditions. Transportation options include the MBTA Orange Line's Wellington Station and the recently opened Green Line Extension stations at Medford/Tufts and Ball Square, providing direct access to downtown Boston. Medford holds a special place in holiday history as the birthplace of "Jingle Bells," composed by James Pierpont, and celebrates its heritage through community events throughout the year.
Median Household Income
$112,736
Average: $139,376
Education
26,495
Residents Have a Degree
Job Market
34,024
Workers Employed
Median Age
38 Years
Largest Age Group
30-39 Years
Approximately 20% of Residents
Under 20
19%
Over 65
17%
Housing Distribution
In Medford, there are roughly the same number of renters and homeowners.

Education Distribution
Review this city's overall education levels.

As of July 2026, the average apartment rent in Medford, MA is $2,795 for a studio, $3,058 for one bedroom, $3,591 for two bedrooms, and $4,338 for three bedrooms. Apartment rent in Medford has increased by 4.5% in the past year.
Explore how walkable, bikeable, drivable, and transit-friendly Medford, MA is for everyday living.
Moderately Walkable
Walkability
Some Public Transit
Transit
Very Drivable
Drivability
Moderately Bikeable
Bikeability
Public
Grades PK-5
559 Students

Public
Grades PK-5
534 Students

John J McGlynn Elementary School
Public
Grades PK-5
498 Students

Public
Grades PK-5
424 Students
Public
Grades 6-8
439 Students
Public
Grades 6-8
438 Students
Public
Grades PK & 9-12
1,210 Students
Public
Grades PK & 9-12
1,210 Students
Medford Vocational Technical High School
Public
Grades 9-12
257 Students

Public
Grades 9-12
18 Students
† Our analysis of utilities, groceries, transportation, healthcare, home prices, and other goods and services is sourced from the Cost of Living Index, a respected benchmark published by the Council for Community and Economic Research (C2ER) that provides a thorough overview of living expenses across different regions.
Rent data is provided by CoStar Group’s Market Trend reports. As the industry leader in commercial real estate information, analytics, and news, CoStar conducts extensive research to produce and maintain a comprehensive database of commercial real estate information. We combine this data with public record to provide the most up-to-date rental information available.
Consumer goods, services, and home prices are sourced from the Cost of Living Index published by the Council for Community and Economic Research (C2ER). The data on this page is updated quarterly. It was last published in June 2026.
Demographic information comes from Neustar and combines detailed address data with U.S. Census and American Community Survey statistics to produce reliable local estimates.


