Median Age
43 Years
Largest Age Group
35-44 Years
Approximately 15% of Residents
Under 20
20%
Over 65
21%

Avg Rent
$2,445
Population
19,536
Renter Mix
34% Rent
About 17 miles south of downtown Boston, South Weymouth offers New England charm without the city price tag. Columbian Square anchors daily life with retail shops, eateries, and landmark buildings -- the Fogg Library, Fogg Opera House Building, and Old South Union Church among them. Groceries are within easy walking distance, and the neighborhood's tree-lined streets and quiet atmosphere make it easy to decompress after a long day.
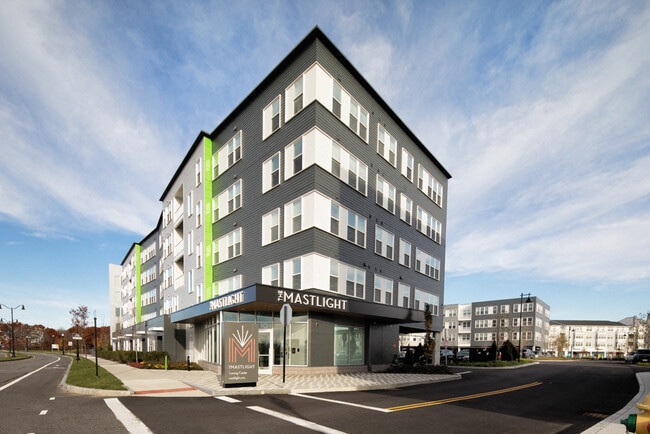
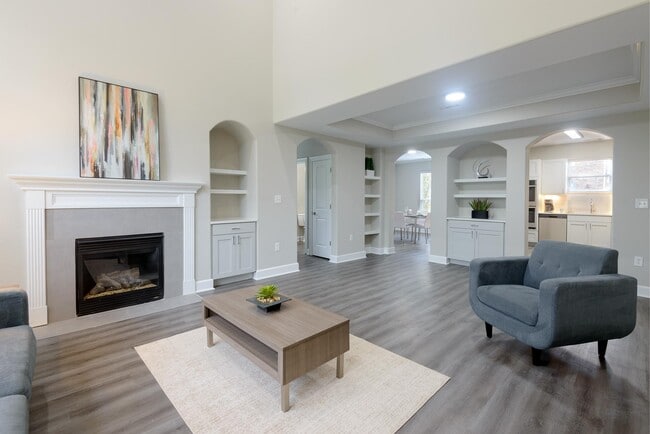
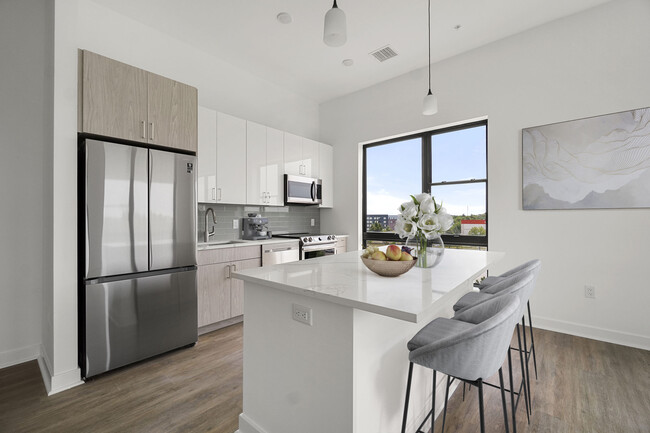
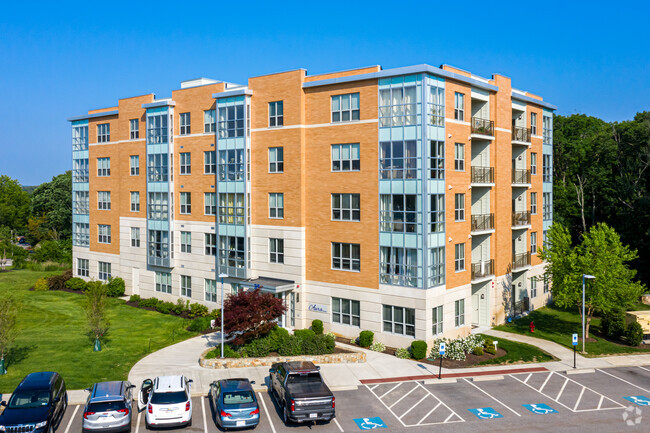
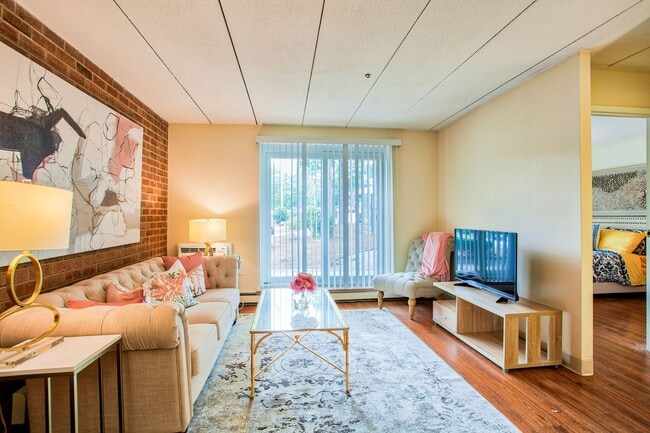
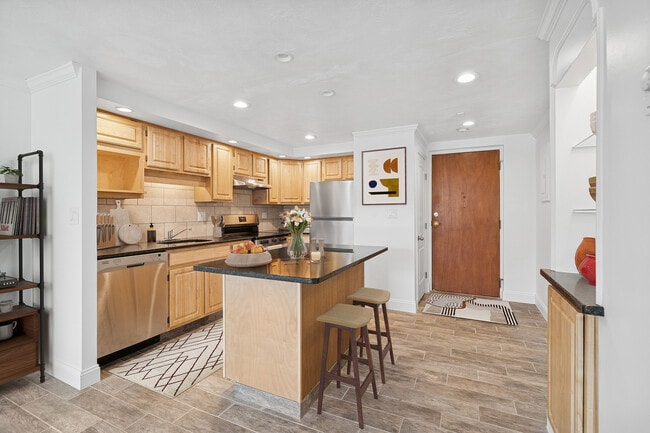
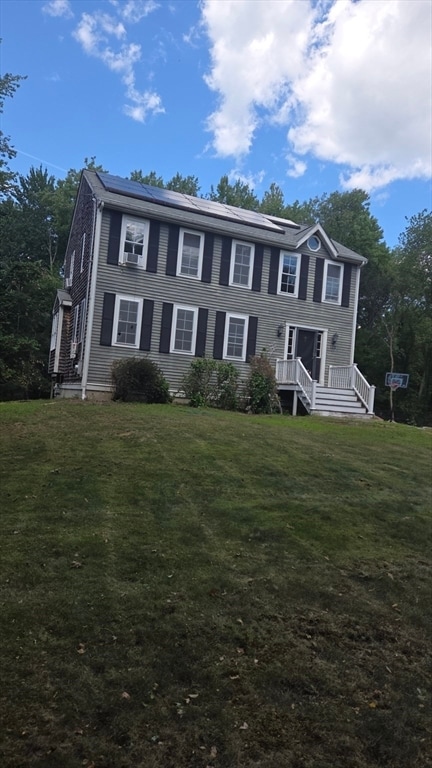
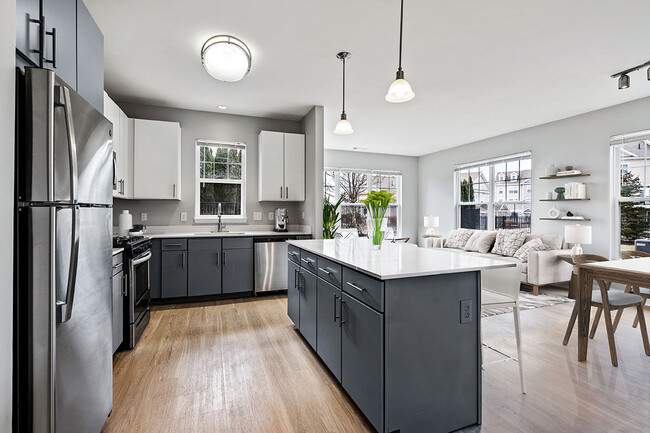
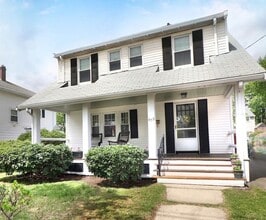
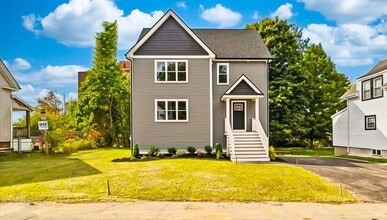
The housing stock reflects classic New England sensibilities: Cape Cods, bungalows, Colonials, Victorians, and raised ranches share the streetscape with modern apartment communities. Renters will find apartment communities ranging from cozy one-bedroom units to spacious multi-bedroom homes, spanning both historic and contemporary builds.
As part of Weymouth, the second-oldest settlement in Massachusetts, South Weymouth carries deep historical roots while actively looking forward. South Shore Hospital, the area's largest employer and a regional healthcare anchor, is based here. The former Naval Air Station site is being redeveloped as Union Point, a 1,400-acre mixed-use community taking shape with residential, retail, and commercial uses.
Median Household Income
$112,002
Average: $134,904
Education
7,544
Residents Have a Degree
Job Market
11,263
Workers Employed
Median Age
43 Years
Largest Age Group
35-44 Years
Approximately 15% of Residents
Under 20
20%
Over 65
21%
Housing Distribution
South Weymouth has more homeowners than renters.

Education Distribution
Review this city's overall education levels.

As of September 2026, the average apartment rent in South Weymouth, MA is $2,288 for a studio, $2,464 for one bedroom, $3,144 for two bedrooms, and $4,318 for three bedrooms. Apartment rent in South Weymouth has increased by 3.8% in the past year.
Explore how walkable, bikeable, drivable, and transit-friendly South Weymouth, MA is for everyday living.
Fairly Walkable
Walkability
Minimal Public Transit
Transit
Exceptionally Drivable
Drivability
Fairly Bikeable
Bikeability

† Our analysis of utilities, groceries, transportation, healthcare, home prices, and other goods and services is sourced from the Cost of Living Index, a respected benchmark published by the Council for Community and Economic Research (C2ER) that provides a thorough overview of living expenses across different regions.
Rent data is provided by CoStar Group’s Market Trend reports. As the industry leader in commercial real estate information, analytics, and news, CoStar conducts extensive research to produce and maintain a comprehensive database of commercial real estate information. We combine this data with public record to provide the most up-to-date rental information available.
Consumer goods, services, and home prices are sourced from the Cost of Living Index published by the Council for Community and Economic Research (C2ER). The data on this page is updated quarterly. It was last published in September 2026.
Demographic information comes from Neustar and combines detailed address data with U.S. Census and American Community Survey statistics to produce reliable local estimates.