Median Age
38 Years
Largest Age Group
35-44 Years
Approximately 23% of Residents
Under 20
21%
Over 65
12%


Area Guide
Avg Rent
$3,837
Population
15,444
Renter Mix
72% Rent
Located in Los Angeles' Westside, Playa Vista offers thoughtfully designed neighborhoods centered around Playa Vista Park, complete with a bandshell for outdoor performances. One-bedroom apartments in this planned community average $3,889, while two-bedroom homes average $5,133. The community surrounds several natural attractions, including the Playa Vista Riparian Corridor and the restored Ballona Wetlands, providing residents with peaceful outdoor spaces.
Once the headquarters of Hughes Aircraft Company and birthplace of the historic Spruce Goose aircraft, Playa Vista has evolved into a technology center, home to major companies like Google, Facebook, and Electronic Arts. The neighborhood features the Playa Vista Branch Library, Concert Park, and Ballona Discovery Park, which showcases exhibits about local history and ecology. Residents have access to walking trails, dog parks, and sports facilities throughout the community. Environmental consciousness shapes the neighborhood's design, with recycled water used for maintaining parks and landscaping.
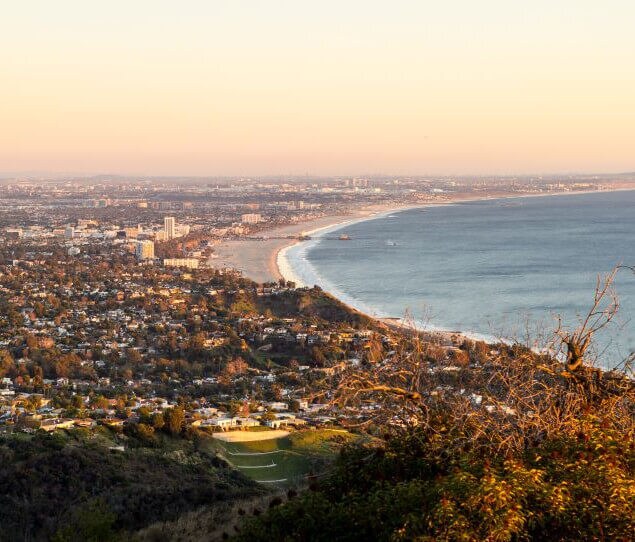
Overlooking the beach from the Santa Monica mountains
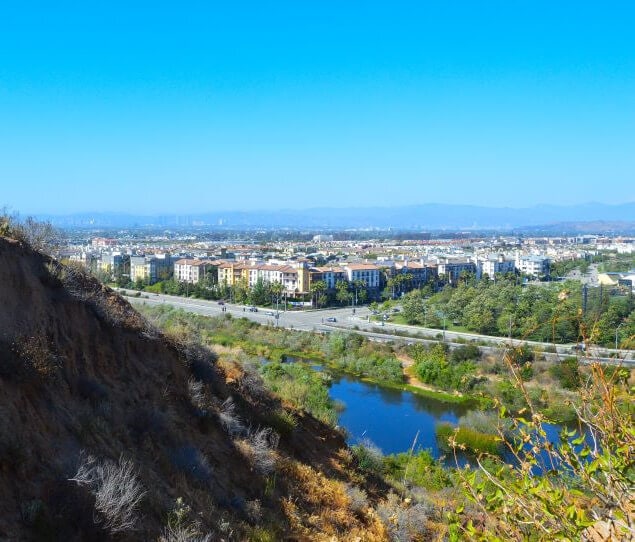
Views from the Playa Vista bluff trail
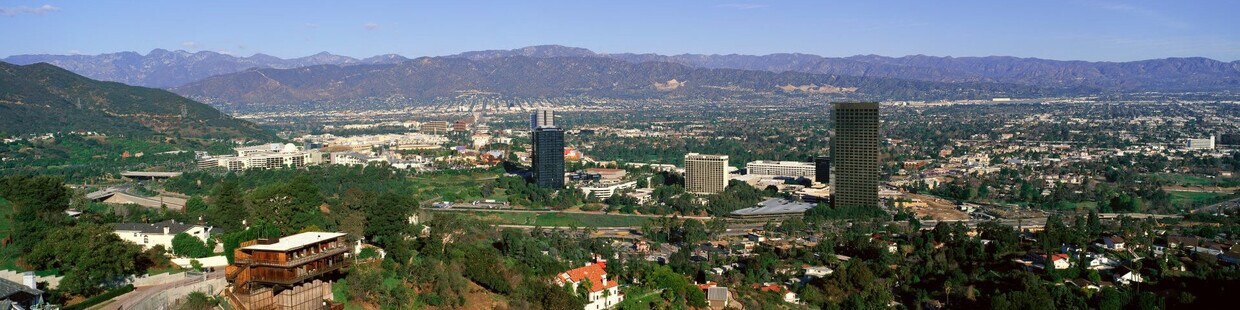
Speeding highway traffic in the city
Median Household Income
$154,362
Average: $175,944
Education
9,910
Residents Have a Degree
Job Market
9,134
Workers Employed
Median Age
38 Years
Largest Age Group
35-44 Years
Approximately 23% of Residents
Under 20
21%
Over 65
12%
Housing Distribution
Playa Vista has more renters than homeowners.

Education Distribution
Review this city's overall education levels.

As of July 2026, the average apartment rent in Playa Vista, CA is $3,666 for a studio, $3,862 for one bedroom, $5,128 for two bedrooms, and $4,689 for three bedrooms. Apartment rent in Playa Vista has increased by 1.5% in the past year.
Explore how walkable, bikeable, drivable, and transit-friendly Playa Vista, CA is for everyday living.
Moderately Walkable
Walkability
Some Public Transit
Transit
Exceptionally Drivable
Drivability
Moderately Bikeable
Bikeability
† Our analysis of utilities, groceries, transportation, healthcare, home prices, and other goods and services is sourced from the Cost of Living Index, a respected benchmark published by the Council for Community and Economic Research (C2ER) that provides a thorough overview of living expenses across different regions.
Rent data is provided by CoStar Group’s Market Trend reports. As the industry leader in commercial real estate information, analytics, and news, CoStar conducts extensive research to produce and maintain a comprehensive database of commercial real estate information. We combine this data with public record to provide the most up-to-date rental information available.
Consumer goods, services, and home prices are sourced from the Cost of Living Index published by the Council for Community and Economic Research (C2ER). The data on this page is updated quarterly. It was last published in June 2026.
Demographic information comes from Neustar and combines detailed address data with U.S. Census and American Community Survey statistics to produce reliable local estimates.


