Median Age
43 Years
Largest Age Group
40-49 Years
Approximately 14% of Residents
Under 20
23%
Over 65
19%

Avg Rent
$2,511
Population
18,915
Renter Mix
24% Rent
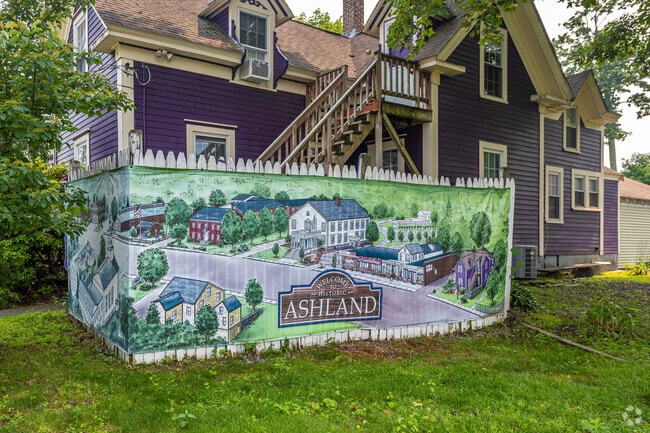
Set directly between Worcester and Boston, Ashland is a serene Massachusetts suburb that’s big on community. With a Main St. full of locally owned businesses and cafes, Ashland is plenty entertaining.
There are large, traditional homes and low-lying apartment complexes that cater to every renter, and Ashland State Park makes for a prime picnic spot or just somewhere to unwind. Every third Saturday in September the town celebrates Ashland Day. Stone Park becomes a small carnival full of rides and food vendors, and the day ends with fireworks. There’s also a weekly farmers market to enjoy.
Ashland is great for commuters since it’s right in the middle of Boston and Worcester. But if you don’t have a car, there’s also rail service to Ashland from Boston’s South Station.
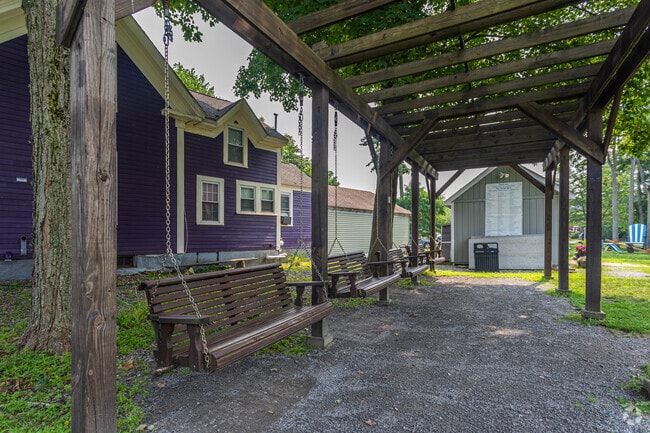
Floating benches for people to enjoy in Ashland.
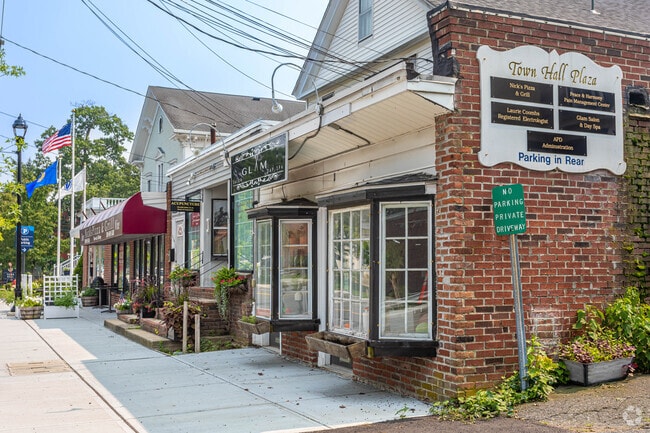
Ashland residents have easy access to many retail and dining options.
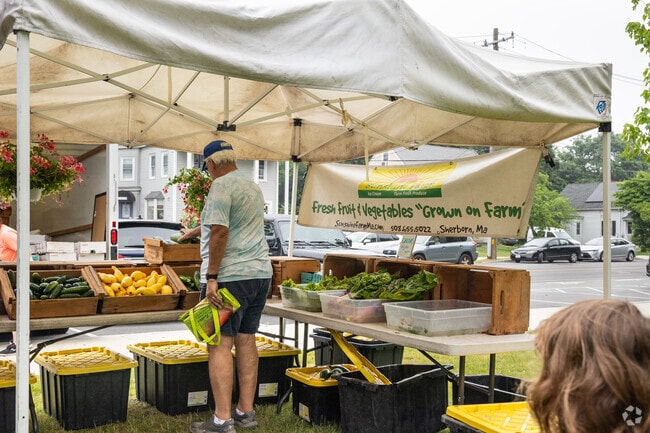
A variety of produce is available from local vendors at the Ashland Farmers Market.
Stone Park in Ashland has basketball and baseball fields for the community.
Rows of bookshelves line the aisles of Ashland Public Library.
Trains at Ashland Commuter Rail Train Station provides convenient transportation to residents.
Median Household Income
$121,417
Average: $152,009
Education
8,444
Residents Have a Degree
Job Market
11,120
Workers Employed
Median Age
43 Years
Largest Age Group
40-49 Years
Approximately 14% of Residents
Under 20
23%
Over 65
19%
Housing Distribution
Ashland has more homeowners than renters.

Education Distribution
Review this city's overall education levels.

As of July 2026, the average apartment rent in Ashland, MA is $2,036 for a studio, $2,511 for one bedroom, $2,617 for two bedrooms, and $1,876 for three bedrooms. Apartment rent in Ashland has increased by 5.8% in the past year.
Explore how walkable, bikeable, drivable, and transit-friendly Ashland, MA is for everyday living.
Fairly Walkable
Walkability
Limited Public Transit
Transit
Very Drivable
Drivability
Moderately Bikeable
Bikeability
David Mindess Elementary School
Public
Grades K-5
657 Students

Public
Grades K-5
597 Students

Henry E Warren Elementary School
Public
Grades K-5
597 Students
Public
Grades 6-8
678 Students

Public
Grades 6-8
678 Students
Public
Grades 9-12
888 Students

Public
Grades 9-12
888 Students
† Our analysis of utilities, groceries, transportation, healthcare, home prices, and other goods and services is sourced from the Cost of Living Index, a respected benchmark published by the Council for Community and Economic Research (C2ER) that provides a thorough overview of living expenses across different regions.
Rent data is provided by CoStar Group’s Market Trend reports. As the industry leader in commercial real estate information, analytics, and news, CoStar conducts extensive research to produce and maintain a comprehensive database of commercial real estate information. We combine this data with public record to provide the most up-to-date rental information available.
Consumer goods, services, and home prices are sourced from the Cost of Living Index published by the Council for Community and Economic Research (C2ER). The data on this page is updated quarterly. It was last published in June 2026.
Demographic information comes from Neustar and combines detailed address data with U.S. Census and American Community Survey statistics to produce reliable local estimates.


