Median Age
40 Years
Largest Age Group
30-39 Years
Approximately 14% of Residents
Under 20
23%
Over 65
18%


Avg Rent
$2,274
Population
74,650
Renter Mix
48% Rent
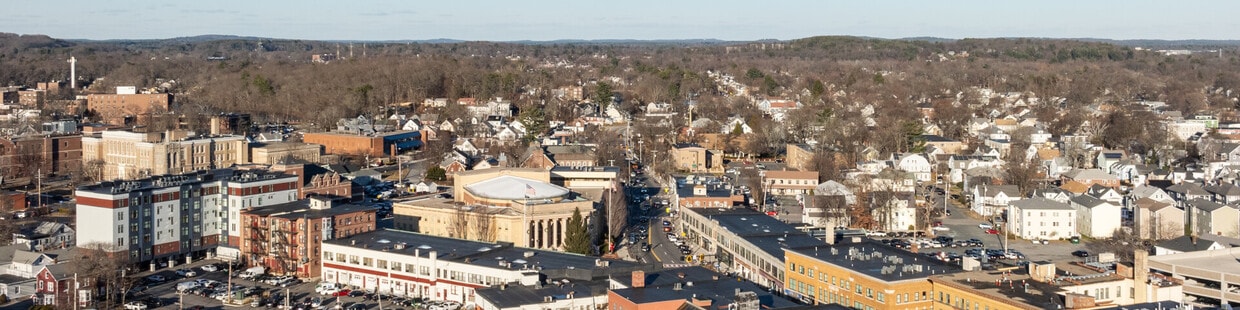
Located in MetroWest Massachusetts, Framingham combines residential comfort with city conveniences. The city offers various housing options across its neighborhoods, from apartment communities to single-family homes. Current rental data shows one-bedroom apartments average $2,257, reflecting a 6.8% increase from last year. The Golden Triangle district provides apartment communities near retail centers, while established areas like Saxonville and Nobscot maintain their traditional character. Outdoor spaces include the 400-acre Cushing Memorial Park and Garden in the Woods, home to the New England Wild Flower Society's extensive native plant collection.
Framingham's development continues to shape its character. As home to Framingham State University and the global headquarters of TJX Companies, the city maintains a strong economic foundation. Downtown Framingham features an international atmosphere, particularly evident in its Brazilian-American community's contributions to local commerce and dining. The city's historical significance includes its connection to Crispus Attucks, recognized as the first person killed in the Boston Massacre. Cultural attractions include the Amazing Things Arts Center and the Danforth Art Museum, while outdoor recreation opportunities exist at Callahan State Park and along the Cochituate Rail Trail.
Learn new tricks at Farm Pond Park in Framingham.
The Natick Mall offers Framingham residents a cozy atmosphere to browse the shops.
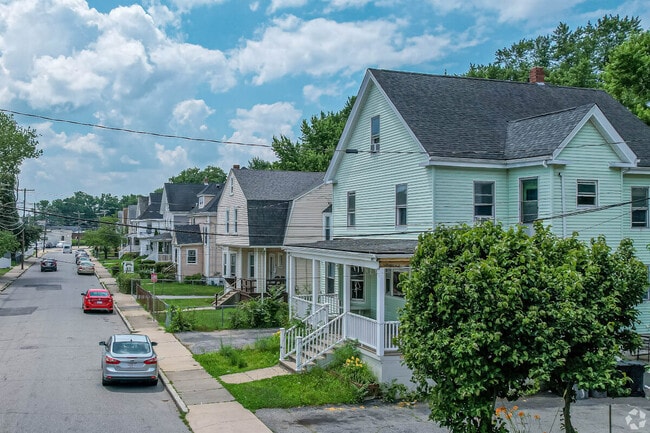
Multi-family homes in Framingham accommodates a denser population.
Median Household Income
$92,728
Average: $124,729
Education
29,806
Residents Have a Degree
Job Market
42,024
Workers Employed
Median Age
40 Years
Largest Age Group
30-39 Years
Approximately 14% of Residents
Under 20
23%
Over 65
18%
Housing Distribution
Framingham has more homeowners than renters.

Education Distribution
Review this city's overall education levels.

As of July 2026, the average apartment rent in Framingham, MA is $1,825 for a studio, $2,274 for one bedroom, $2,576 for two bedrooms, and $3,153 for three bedrooms. Apartment rent in Framingham has increased by 1.4% in the past year.
The cost of living in Framingham, MA is 35.5% higher than the national average. Generally, housing in Framingham is 68.6% more expensive than the national average, with rent falling between $1,825 - $3,153. You can expect to pay 4.3% more for groceries, 50.9% more for utilities, and 7.2% more for transportation.
Compare Cities
Explore how walkable, bikeable, drivable, and transit-friendly Framingham, MA is for everyday living.
Fairly Walkable
Walkability
Limited Public Transit
Transit
Exceptionally Drivable
Drivability
Fairly Bikeable
Bikeability
Public
Grades K-5
541 Students

Public
Grades K-5
382 Students

Public
Grades K-5
322 Students

Mary E Stapleton Elementary School
Public
Grades K-5
322 Students
Public
Grades K-5
653 Students

Christa McAuliffe Regional Charter Public School
Public
Grades 6-8
315 Students
Public
Grades 6-8
726 Students
Public
Grades 6-8
726 Students
Public
Grades 6-8
495 Students
Public
Grades 6-8
495 Students
Public
Grades 9-12
2,271 Students
Joseph P Keefe Technical High School
Public
Grades 9-12
907 Students
† Our analysis of utilities, groceries, transportation, healthcare, home prices, and other goods and services is sourced from the Cost of Living Index, a respected benchmark published by the Council for Community and Economic Research (C2ER) that provides a thorough overview of living expenses across different regions.
Rent data is provided by CoStar Group’s Market Trend reports. As the industry leader in commercial real estate information, analytics, and news, CoStar conducts extensive research to produce and maintain a comprehensive database of commercial real estate information. We combine this data with public record to provide the most up-to-date rental information available.
Consumer goods, services, and home prices are sourced from the Cost of Living Index published by the Council for Community and Economic Research (C2ER). The data on this page is updated quarterly. It was last published in June 2026.
Demographic information comes from Neustar and combines detailed address data with U.S. Census and American Community Survey statistics to produce reliable local estimates.


