Median Age
41 Years
Largest Age Group
30-39 Years
Approximately 15% of Residents
Under 20
22%
Over 65
18%
Avg Rent
$2,384
Population
41,497
Renter Mix
47% Rent
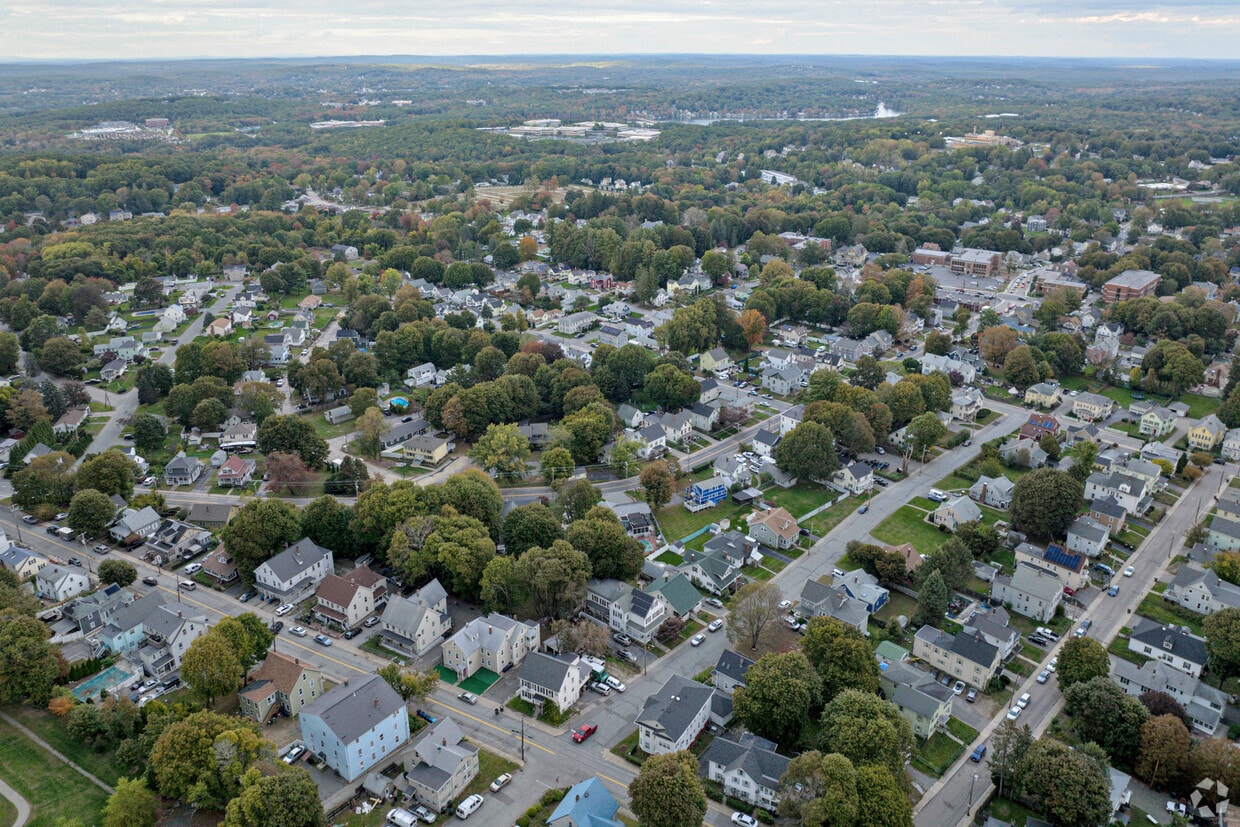
Marlborough, located in MetroWest Massachusetts, offers renters a blend of history and contemporary living. Positioned at the intersection of I-495, I-290, and the Massachusetts Turnpike, the city provides convenient access to both Boston and Worcester. Outdoor enthusiasts appreciate Lake Williams and Fort Meadow Reservoir, while the housing market includes apartments in the Southwest Quadrant and residences near downtown. One-bedroom apartments rent for $2,430 per month, with two-bedroom units at $2,810.
Downtown Marlborough along Main Street features local shops and restaurants, while the Southwest Quadrant serves as a commercial center. The New England Sports Center, housing multiple ice rinks, stands as a regional attraction. The city's educational landscape includes several elementary schools and the Advanced Math & Science Academy Charter School, with higher education options available throughout the greater Boston region.
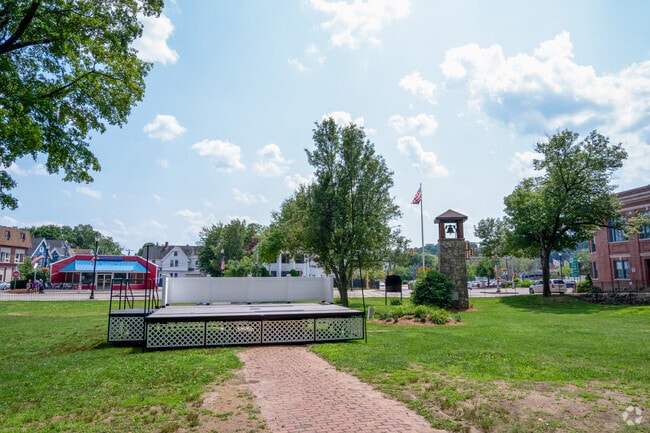
The stage at Union Common Park in Marlborough, Massachusetts.
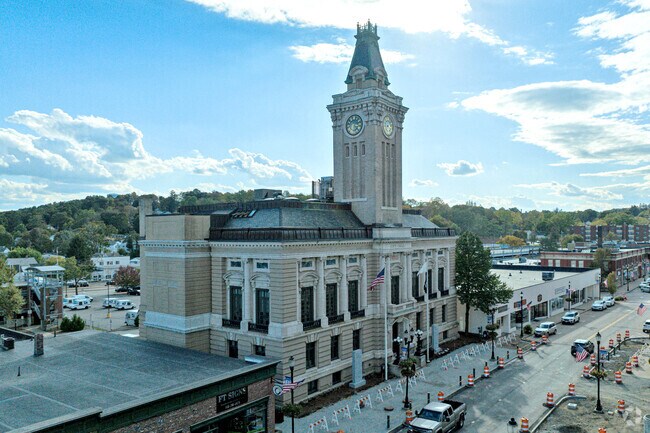
The Marlborough City Hall is located downtown.
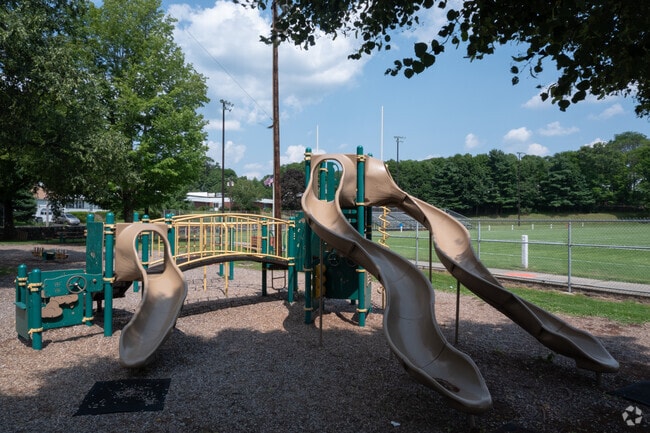
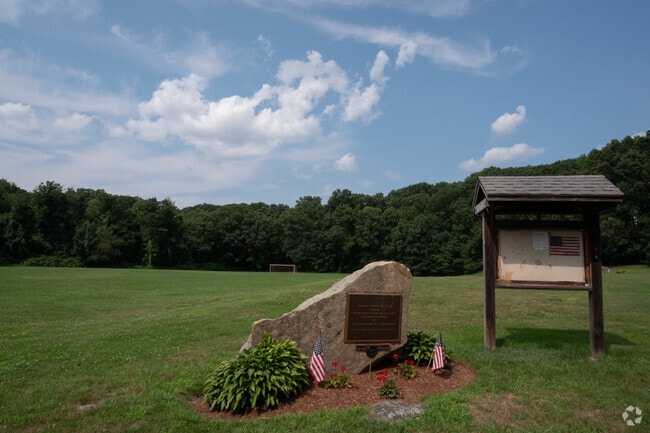
Soccer field in the Marlborough community at Korean Veterans Field.
Median Household Income
$90,457
Average: $114,236
Education
13,909
Residents Have a Degree
Job Market
24,416
Workers Employed
Median Age
41 Years
Largest Age Group
30-39 Years
Approximately 15% of Residents
Under 20
22%
Over 65
18%
Housing Distribution
Marlborough has more homeowners than renters.

Education Distribution
Review this city's overall education levels.

As of July 2026, the average apartment rent in Marlborough, MA is $1,669 for a studio, $2,389 for one bedroom, $2,730 for two bedrooms, and $3,449 for three bedrooms. Apartment rent in Marlborough has decreased by -0.6% in the past year.
Explore how walkable, bikeable, drivable, and transit-friendly Marlborough, MA is for everyday living.
Moderately Walkable
Walkability
Limited Public Transit
Transit
Very Drivable
Drivability
Fairly Bikeable
Bikeability
Goodnow Brothers Elementary School
Public
Grades K-5
773 Students

Public
Grades K-5
648 Students
Public
Grades K-5
472 Students

Public
Grades K-5
525 Students

Advanced Math and Science Academy Charter School
Public
Grades 6-12
963 Students

1 Lt Charles W. Whitcomb School
Public
Grades 6-8
944 Students
Advanced Math and Science Academy Charter School
Public
Grades 6-12
963 Students
Assabet Valley Vocational High School
Public
Grades 9-12
1,131 Students

Public
Grades 9-12
814 Students
Public
Grades 9-12
814 Students
† Our analysis of utilities, groceries, transportation, healthcare, home prices, and other goods and services is sourced from the Cost of Living Index, a respected benchmark published by the Council for Community and Economic Research (C2ER) that provides a thorough overview of living expenses across different regions.
Rent data is provided by CoStar Group’s Market Trend reports. As the industry leader in commercial real estate information, analytics, and news, CoStar conducts extensive research to produce and maintain a comprehensive database of commercial real estate information. We combine this data with public record to provide the most up-to-date rental information available.
Consumer goods, services, and home prices are sourced from the Cost of Living Index published by the Council for Community and Economic Research (C2ER). The data on this page is updated quarterly. It was last published in June 2026.
Demographic information comes from Neustar and combines detailed address data with U.S. Census and American Community Survey statistics to produce reliable local estimates.


