Median Age
33 Years
Largest Age Group
25-34 Years
Approximately 16% of Residents
Under 20
30%
Over 65
11%

Area Guide
Avg Rent
$1,337
Population
225,647
Renter Mix
52% Rent
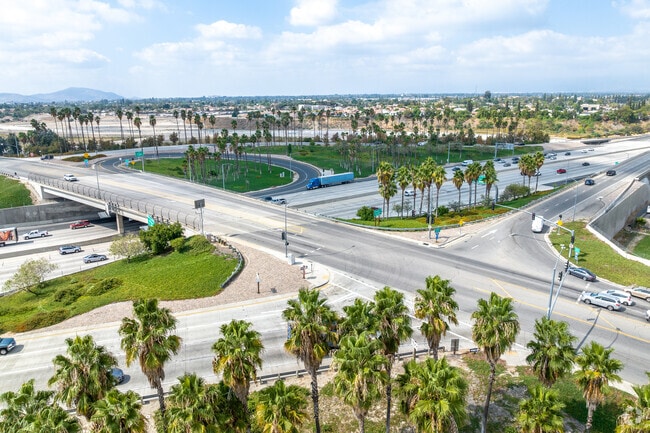
Living in San Bernardino puts you at the foot of the San Bernardino Mountains, offering a stunning backdrop to this Southern California city. Located about 60 miles east of Los Angeles, San Bernardino features diverse housing options from apartment communities to single-family homes, with current average rents ranging from $1,167 for studios to $2,772 for four-bedroom units. The area around California State University San Bernardino adds to the city's character, while established neighborhoods like Arrowhead Springs showcase the area's heritage. Residents enjoy outdoor recreation at Blair Park, known for its skate park and hiking trails, while Perris Hill Park offers amenities including the historic Roosevelt Bowl and Fiscalini Field.
San Bernardino's location near the Cajon and San Gorgonio passes has made it an important transportation center, contributing to the local economy. Downtown features the restored California Theatre, home to the San Bernardino Symphony Orchestra and year-round performances. History buffs can visit the McDonald's Museum, located at the site of the original restaurant established in 1940. The rental market remains stable, with year-over-year increases ranging from 0.1% to 3.4% across different unit sizes, offering affordable options within reach of Los Angeles.
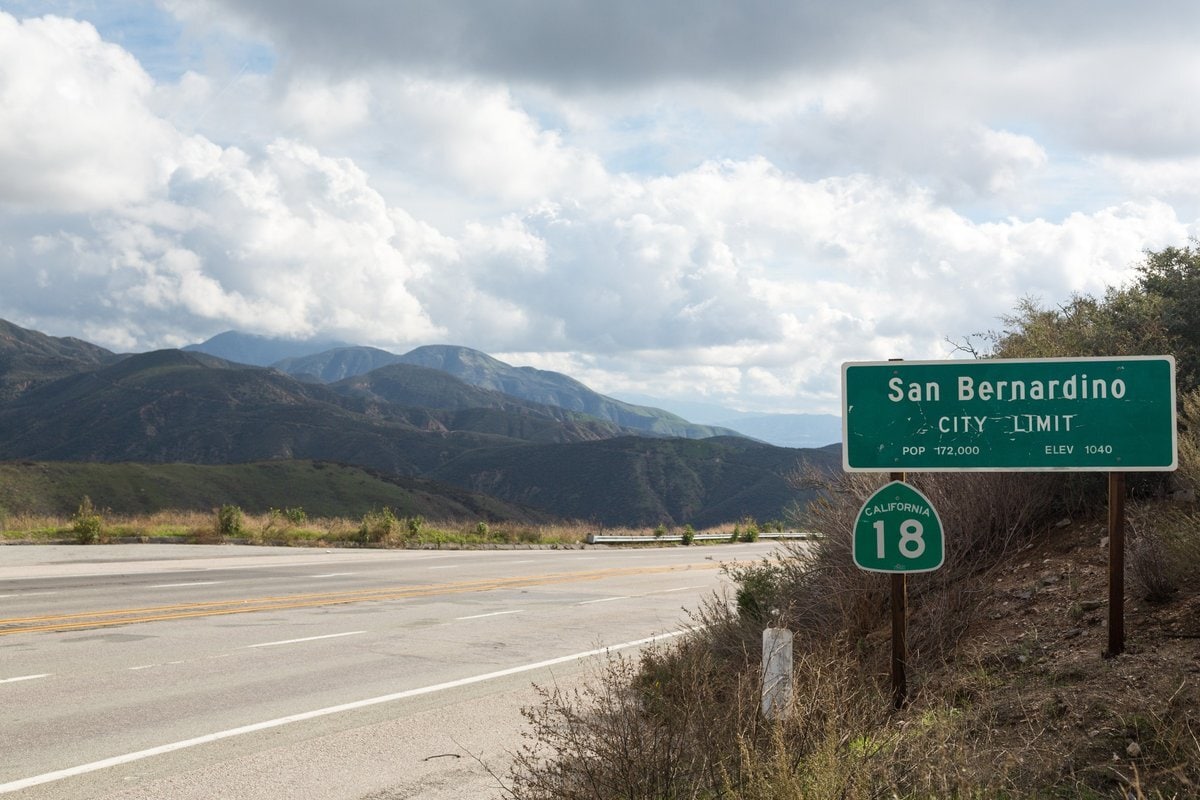
Entering the city of San Bernardino, you are welcomed by a piece of the town's history.
Median Household Income
$60,070
Average: $75,287
Education
27,202
Residents Have a Degree
Job Market
99,316
Workers Employed
Median Age
33 Years
Largest Age Group
25-34 Years
Approximately 16% of Residents
Under 20
30%
Over 65
11%
Housing Distribution
San Bernardino has more renters than homeowners.

Education Distribution
Review this city's overall education levels.

As of July 2026, the average apartment rent in San Bernardino, CA is $1,166 for a studio, $1,337 for one bedroom, $1,705 for two bedrooms, and $2,201 for three bedrooms. Apartment rent in San Bernardino has increased by 1.5% in the past year.
Explore how walkable, bikeable, drivable, and transit-friendly San Bernardino, CA is for everyday living.
Fairly Walkable
Walkability
Minimal Public Transit
Transit
Exceptionally Drivable
Drivability
Somewhat Bikeable
Bikeability
Public
Grades K-5
586 Students

North Verdemont Elementary School
Public
Grades K-5
549 Students
Public
Grades K-5
549 Students
Public
Grades K-8
940 Students

Public
Grades K-5
586 Students
Colonel Joseph C. Rodriguez Prep Academy
Public
Grades 6-8
640 Students

Richardson PREP HI Middle School
Public
Grades 6-8
583 Students
Public
Grades K-8
940 Students
Norton Science And Language Academy
Public
Grades K-12
1,249 Students

Public
Grades 6-8
742 Students
Public
Grades 9-12
269 Students
Norton Science And Language Academy
Public
Grades K-12
1,249 Students
Public
Grades 9-12
2,748 Students

Public
Grades 9-12
2,748 Students
Public
Grades 9-12
1,246 Students

† Our analysis of utilities, groceries, transportation, healthcare, home prices, and other goods and services is sourced from the Cost of Living Index, a respected benchmark published by the Council for Community and Economic Research (C2ER) that provides a thorough overview of living expenses across different regions.
Rent data is provided by CoStar Group’s Market Trend reports. As the industry leader in commercial real estate information, analytics, and news, CoStar conducts extensive research to produce and maintain a comprehensive database of commercial real estate information. We combine this data with public record to provide the most up-to-date rental information available.
Consumer goods, services, and home prices are sourced from the Cost of Living Index published by the Council for Community and Economic Research (C2ER). The data on this page is updated quarterly. It was last published in June 2026.
Demographic information comes from Neustar and combines detailed address data with U.S. Census and American Community Survey statistics to produce reliable local estimates.


