Median Age
36 Years
Largest Age Group
30-39 Years
Approximately 19% of Residents
Under 20
22%
Over 65
16%


Avg Rent
$1,437
Population
229,548
Renter Mix
64% Rent
Featuring a historic charm and progressive attitude, Richmond is the capital city of Virginia. Nicknamed the “Creative Culture,” art, history, and a strong sense of community define this eclectic city. Walk through the cobblestone streets to find murals, sculptures, and other forms of public art decorating local businesses and storefronts. From the Virginia Museum of Fine Arts to the Poe Museum, the arts are represented throughout the entire city. Not just for art lovers, foodies thrive in Richmond. The city has been crowned as one of the best spots in the country for great eats, and residents can get a taste of all it has to offer through the countless local restaurants that encompass every cuisine from southern comfort to Korean barbeque. With all the hustle and bustle of the city, residents need an escape into nature, and the city certainly provides. The James River runs through Richmond allowing thrill seeking residents to explore the whitewater rapids. For those not ready to make the plunge into the rapids, the Virginia Capital Trail is a hiking trail that follows along the river. Those lucky enough to live in this dynamic capital city have a large selection of rentals to consider.
Hadad's Lake in Richmond
The historic Richmond Main Street Station was built in 1901
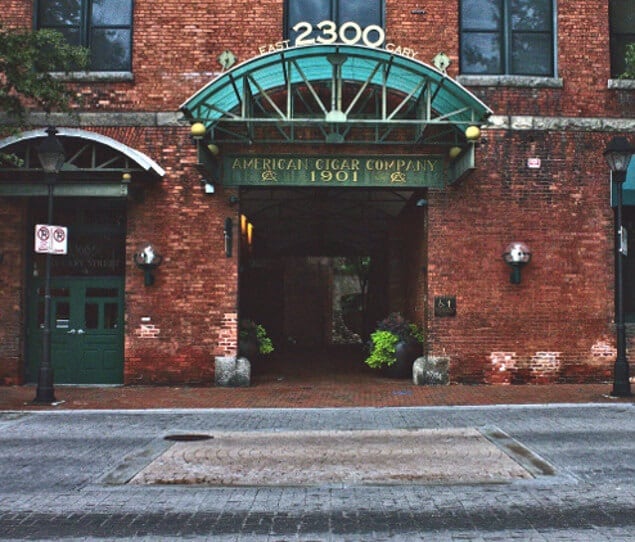
Richmond's historic Tobacco Row
City view from the James River
Median Household Income
$53,556
Average: $80,185
Education
85,523
Residents Have a Degree
Job Market
122,018
Workers Employed
Median Age
36 Years
Largest Age Group
30-39 Years
Approximately 19% of Residents
Under 20
22%
Over 65
16%
Housing Distribution
Richmond has more renters than homeowners.

Education Distribution
Review this city's overall education levels.

As of August 2026, the average apartment rent in Richmond, VA is $1,272 for a studio, $1,439 for one bedroom, $1,620 for two bedrooms, and $2,035 for three bedrooms. Apartment rent in Richmond has increased by 1.3% in the past year.
The cost of living in Richmond, VA is 4.8% lower than the national average. Generally, housing in Richmond is 14.2% less expensive than the national average, with rent falling between $1,272 - $2,035. You can expect to pay 0.4% less for groceries, 3.5% less for utilities, and 2.4% less for transportation.
Compare Cities
Explore how walkable, bikeable, drivable, and transit-friendly Richmond, VA is for everyday living.
Fairly Walkable
Walkability
Limited Public Transit
Transit
Very Drivable
Drivability
Moderately Bikeable
Bikeability
Public
Grades PK-5
682 Students

Public
Grades PK-5
628 Students
Nuckols Farm Elementary School
Public
Grades PK-5
627 Students
Public
Grades PK-5
605 Students
Public
Grades PK-5
545 Students

Public
Grades 6-12
335 Students
Public
Grades 6-8
825 Students

Public
Grades 6-8
825 Students
Public
Grades 6-8
1,072 Students

Public
Grades 6-8
1,072 Students
Public
Grades 9-12
200 Students
Public
Grades 9-12
174 Students
Public
Grades 6-12
335 Students
Public
Grades 9-12
1,773 Students

Public
Grades 9-12
1,773 Students
† Our analysis of utilities, groceries, transportation, healthcare, home prices, and other goods and services is sourced from the Cost of Living Index, a respected benchmark published by the Council for Community and Economic Research (C2ER) that provides a thorough overview of living expenses across different regions.
Rent data is provided by CoStar Group’s Market Trend reports. As the industry leader in commercial real estate information, analytics, and news, CoStar conducts extensive research to produce and maintain a comprehensive database of commercial real estate information. We combine this data with public record to provide the most up-to-date rental information available.
Consumer goods, services, and home prices are sourced from the Cost of Living Index published by the Council for Community and Economic Research (C2ER). The data on this page is updated quarterly. It was last published in June 2026.
Demographic information comes from Neustar and combines detailed address data with U.S. Census and American Community Survey statistics to produce reliable local estimates.


