Median Age
45 Years
Largest Age Group
35-44 Years
Approximately 14% of Residents
Under 20
20%
Over 65
23%


Avg Rent
$2,765
Population
22,625
Renter Mix
34% Rent
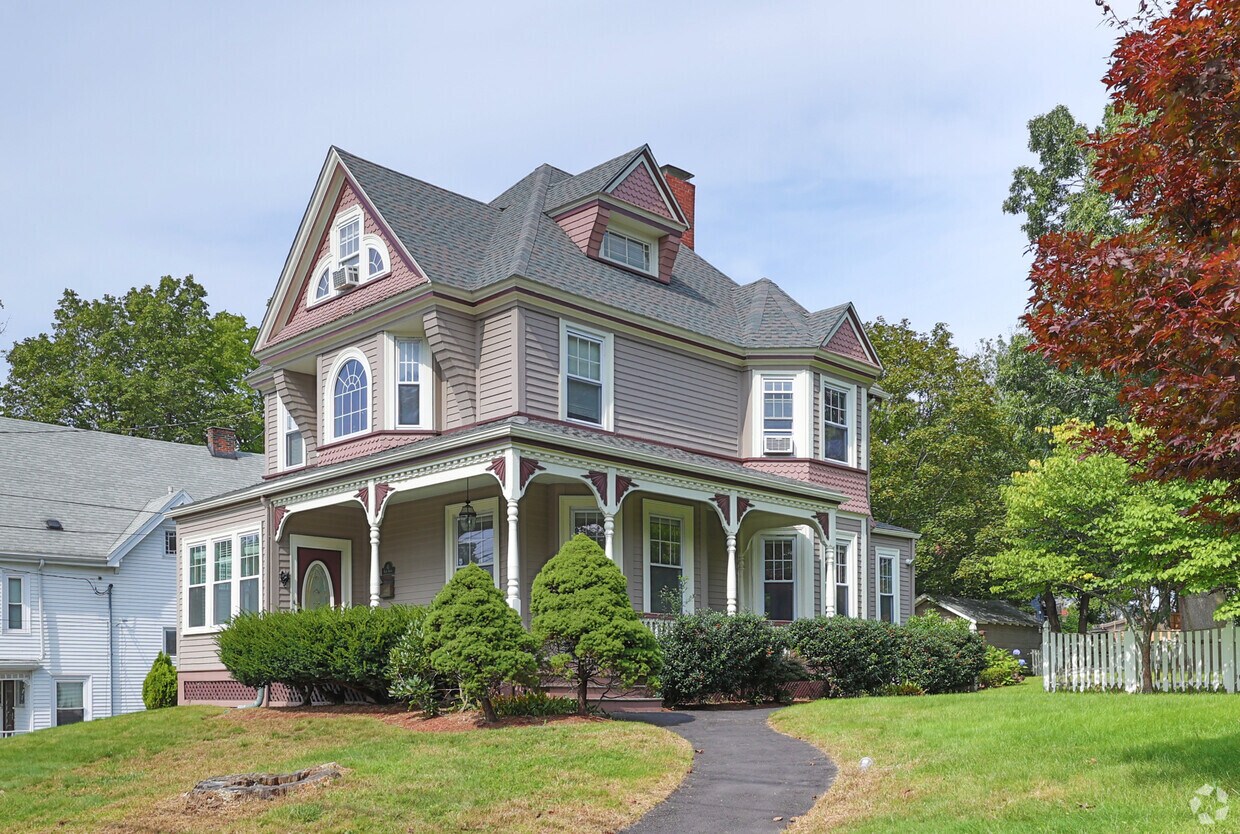
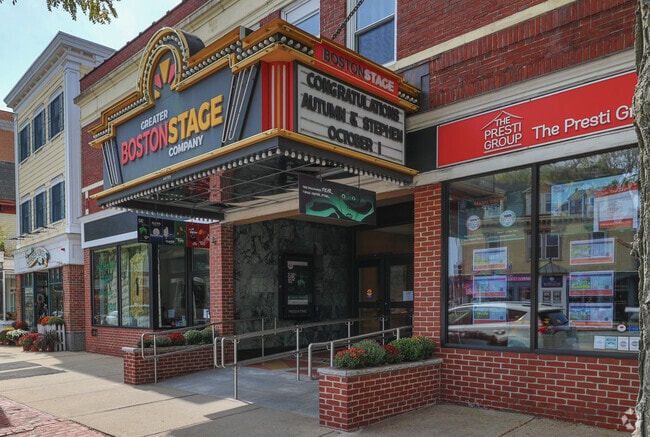
Stoneham sits just six miles north of downtown Boston, close enough to feel the city's pull but settled enough to have a character all its own. This Middlesex County town has deep roots, dating back to 1632 when Governor Winthrop's party first explored the area and discovered Spot Pond near what is now called Bear Hill. Today, the Middlesex Fells Reservation anchors the southern edge of town, bringing thousands of acres of wooded trails practically to residents' doorsteps. The compact downtown district hums with local businesses occupying well-kept historic buildings, and neighborhoods range from quiet, tree-lined streets to areas with closer access to retail and commuter routes. Tufts University in neighboring Medford and Sommerville adds an academic energy to the broader area, and the town is widely recognized as the birthplace of Olympic figure-skating medalist Nancy Kerrigan.
The rental landscape in Stoneham reflects its appeal as a true Boston-area suburb. Apartment communities here include converted multifamily homes, updated colonial-style buildings, and newer mid-rise communities with modern finishes. Renters can choose from studios to spacious three-bedroom layouts, with options spread across both walkable downtown blocks and quieter residential pockets throughout the town's seven square miles.
At Spot Pond boat house in Stoneham is open until October.
There is always a colorful arrangement of flowers outside O'Brien's in Stoneham.
Follow the trails at the Middlesex Fells Reservation in Stoneham.
Bear Hill is a great place to play golf in Stoneham.
Walk along the dirt paths with your dog at the Middlesex Fells Reservation in Stoneham, MA.
Take in the local art displays in Stoneham.
Median Household Income
$113,909
Average: $139,686
Education
8,838
Residents Have a Degree
Job Market
13,224
Workers Employed
Median Age
45 Years
Largest Age Group
35-44 Years
Approximately 14% of Residents
Under 20
20%
Over 65
23%
Housing Distribution
Stoneham has more homeowners than renters.

Education Distribution
Review this city's overall education levels.

As of July 2026, the average apartment rent in Stoneham, MA is $2,131 for a studio, $2,801 for one bedroom, $3,305 for two bedrooms, and $5,074 for three bedrooms. Apartment rent in Stoneham has increased by 5.0% in the past year.
Explore how walkable, bikeable, drivable, and transit-friendly Stoneham, MA is for everyday living.
Fairly Walkable
Walkability
Limited Public Transit
Transit
Exceptionally Drivable
Drivability
Fairly Bikeable
Bikeability
Public
Grades K-5
347 Students

Colonial Park Elementary School
Public
Grades PK-5
221 Students

Public
Grades K-8
678 Students

Public
Grades K-5
362 Students

Public
Grades K-8
678 Students
Public
Grades 9-12
598 Students
Public
Grades 9-12
598 Students
† Our analysis of utilities, groceries, transportation, healthcare, home prices, and other goods and services is sourced from the Cost of Living Index, a respected benchmark published by the Council for Community and Economic Research (C2ER) that provides a thorough overview of living expenses across different regions.
Rent data is provided by CoStar Group’s Market Trend reports. As the industry leader in commercial real estate information, analytics, and news, CoStar conducts extensive research to produce and maintain a comprehensive database of commercial real estate information. We combine this data with public record to provide the most up-to-date rental information available.
Consumer goods, services, and home prices are sourced from the Cost of Living Index published by the Council for Community and Economic Research (C2ER). The data on this page is updated quarterly. It was last published in June 2026.
Demographic information comes from Neustar and combines detailed address data with U.S. Census and American Community Survey statistics to produce reliable local estimates.


