
The Buckley Apartments
480 Franklin St,
Framingham, MA 01702
$2,552 - $3,999 Total Monthly Price
Studio - 3 Beds
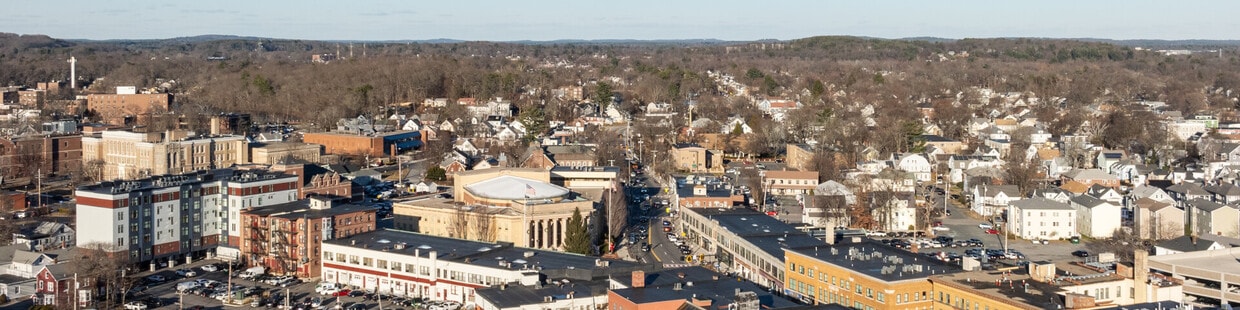


Located in MetroWest Massachusetts, Framingham combines residential comfort with city conveniences. The city offers various housing options across its neighborhoods, from apartment communities to single-family homes. Current rental data shows one-bedroom apartments average $2,257, reflecting a 6.8% increase from last year. The Golden Triangle district provides apartment communities near retail centers, while established areas like Saxonville and Nobscot maintain their traditional character. Outdoor spaces include the 400-acre Cushing Memorial Park and Garden in the Woods, home to the New England Wild Flower Society's extensive native plant collection.
Framingham's development continues to shape its character. As home to Framingham State University and the global headquarters of TJX Companies, the city maintains a strong economic foundation. Downtown Framingham features an international atmosphere, particularly evident in its Brazilian-American community's contributions to local commerce and dining. The city's historical significance includes its connection to Crispus Attucks, recognized as the first person killed in the Boston Massacre. Cultural attractions include the Amazing Things Arts Center and the Danforth Art Museum, while outdoor recreation opportunities exist at Callahan State Park and along the Cochituate Rail Trail.
The Natick Mall offers Framingham residents a cozy atmosphere to browse the shops.
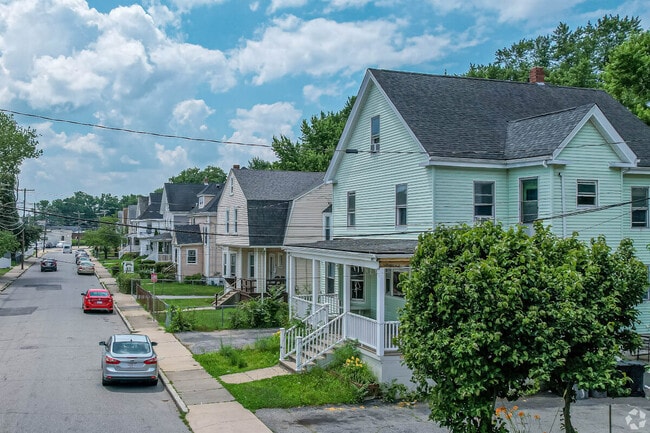
Multi-family homes in Framingham accommodates a denser population.
Learn new tricks at Farm Pond Park in Framingham.
As of March 2026, the average apartment rent in Framingham, MA is $1,776 for a studio, $2,258 for one bedroom, $2,558 for two bedrooms, and $3,124 for three bedrooms. Apartment rent in Framingham has increased by 0.4% in the past year.
The cost of living in Framingham, MA is 35.5% higher than the national average. Generally, housing in Framingham is 68.5% more expensive than the national average, with rent falling between $1,776 - $3,124. You can expect to pay 4.3% more for groceries, 50.7% more for utilities, and 7.5% more for transportation.
Explore how walkable, bikeable, drivable, and transit-friendly Framingham, MA is for everyday living.
Somewhat Walkable
You might be able to get out and walk when living in this area. Some errands can be accomplished on foot, but for others you’ll need a car.
Some Transit
You'll likely want a car when living in this area since it has few transit options.
Somewhat Bikeable
You might be able to find places to ride your bike in this area, but you’ll most likely want your car for most errands.
Public
Grades K-5

Public
Grades K-5

Public
Grades K-5

Public
Grades K-5

Public
Grades K-5
Christa McAuliffe Regional Charter Public School
Public
Grades 6-8
Public
Grades 6-8
Public
Grades 6-8
Public
Grades 6-8
Public
Grades 9-12

3,489
Communities
959,639
Units
894
Cities

159
Communities
26,767
Units
111
Cities

196
Communities
70,873
Units
136
Cities

47
Communities
11,459
Units
40
Cities

15
Communities
5,347
Units
9
Cities

715
Communities
198,674
Units
340
Cities
† Our analysis of utilities, groceries, transportation, healthcare, home prices, and other goods and services is sourced from the Cost of Living Index, a respected benchmark published by the Council for Community and Economic Research (C2ER) that provides a thorough overview of living expenses across different regions.
Rent data is provided by CoStar Group’s Market Trend reports. As the industry leader in commercial real estate information, analytics, and news, CoStar conducts extensive research to produce and maintain a comprehensive database of commercial real estate information. We combine this data with public record to provide the most up-to-date rental information available.
Consumer goods, services, and home prices are sourced from the Cost of Living Index published by the Council for Community and Economic Research (C2ER). The data on this page is updated quarterly. It was last published in February 2026.


