Median Age
42 Years
Largest Age Group
35-44 Years
Approximately 16% of Residents
Under 20
20%
Over 65
18%
Avg Rent
$2,242
Population
101,633
Renter Mix
58% Rent
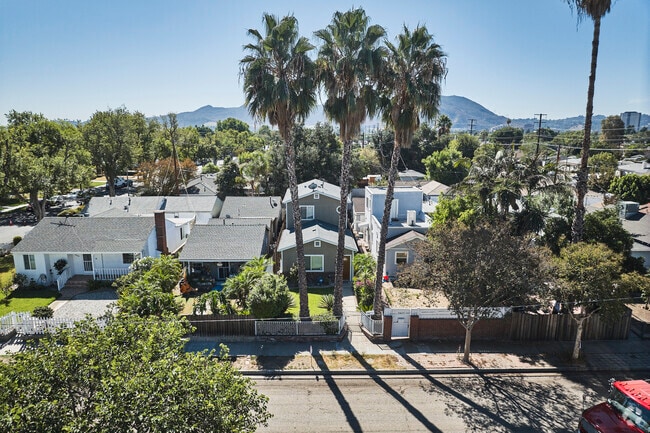
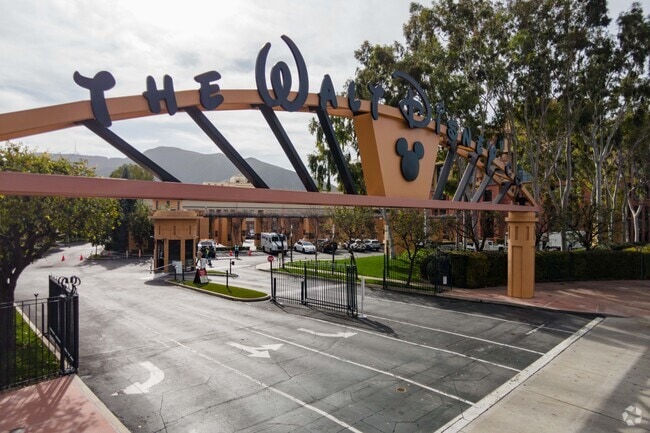
Living in Burbank combines entertainment industry heritage with comfortable suburban living. As home to Warner Bros., Disney, and Netflix, the city's entertainment legacy shapes its character. The rental market currently shows average monthly rates ranging from $1,960 for studios to $5,337 for four-bedroom units, with moderate year-over-year increases ranging from 0.3% to 6.6%. One-bedroom apartments average $2,287, reflecting a 2.2% annual increase.
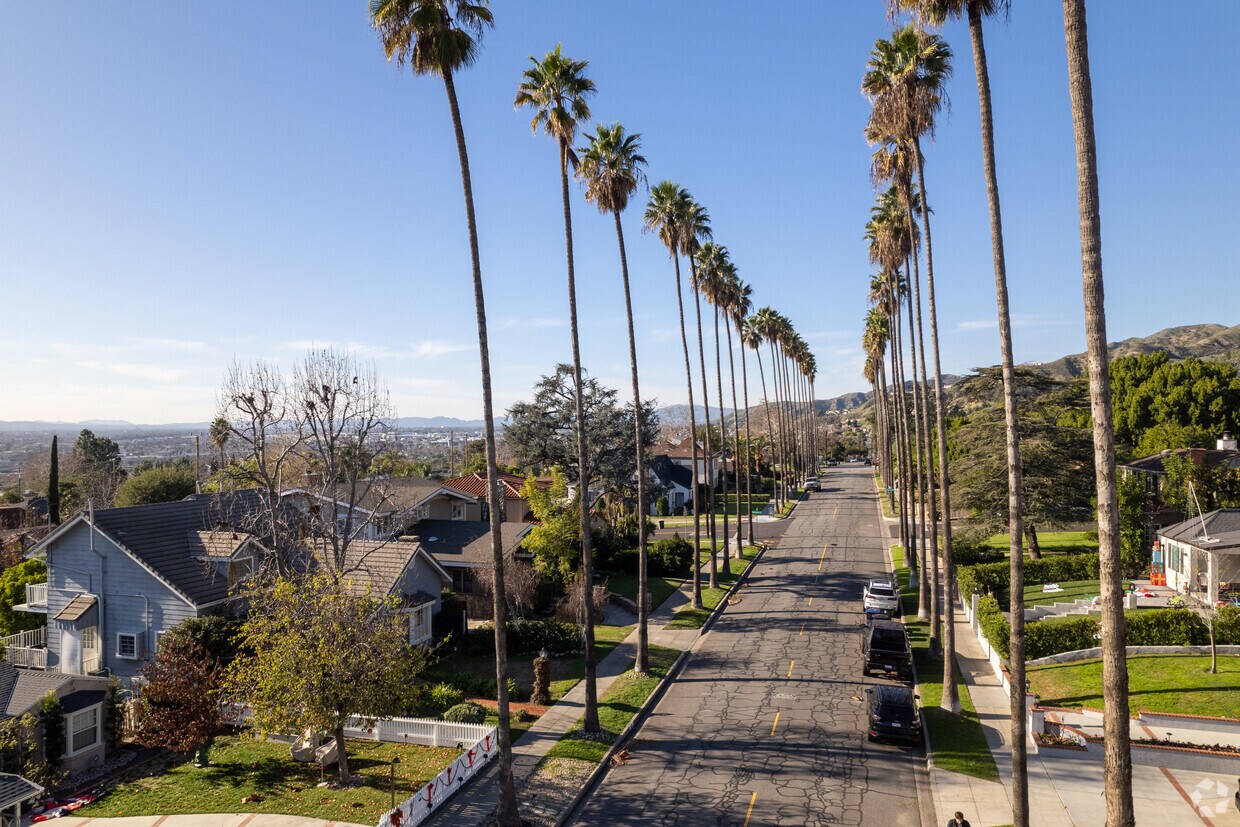
Each Burbank neighborhood has its own character - from the Rancho district with its equestrian zoning to Magnolia Park, where vintage shops and local boutiques line the streets. Outdoor spaces include Johnny Carson Park and the Chandler Bikeway, which connects residents to various parts of the city. The Media District houses major studios, while downtown features shopping at Burbank Town Center and an array of restaurants along San Fernando Boulevard. The city's aviation history includes the former Lockheed Skunk Works facility, where aerospace innovations like the U-2 reconnaissance aircraft were developed. Today, the Hollywood Burbank Airport provides convenient travel options, while the city's public schools and walkable neighborhoods continue to attract new residents.
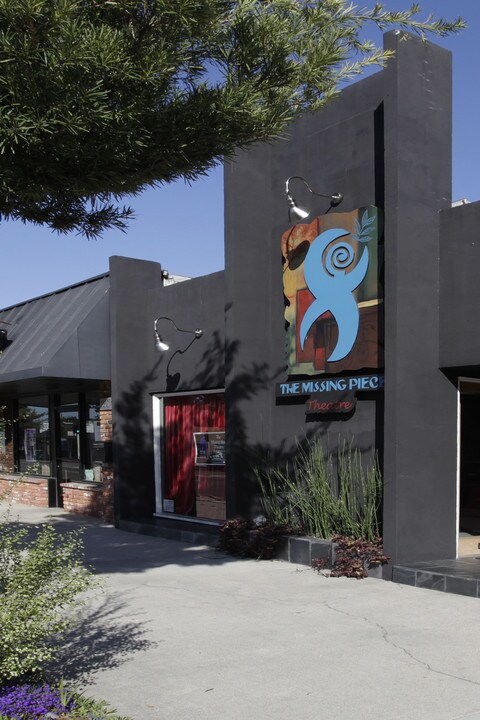
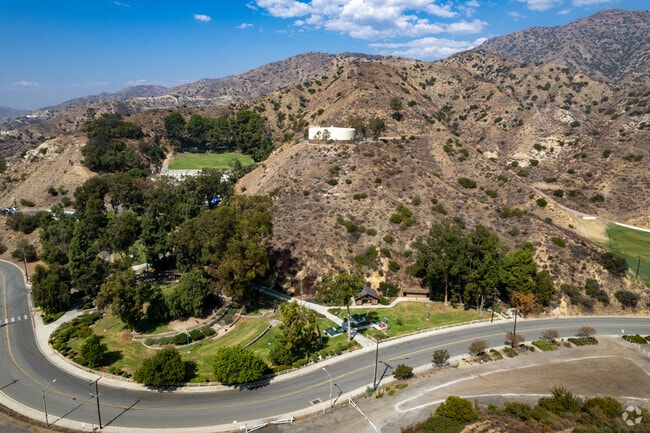
Starlight Bowl Concert Hall theater in the mountains.
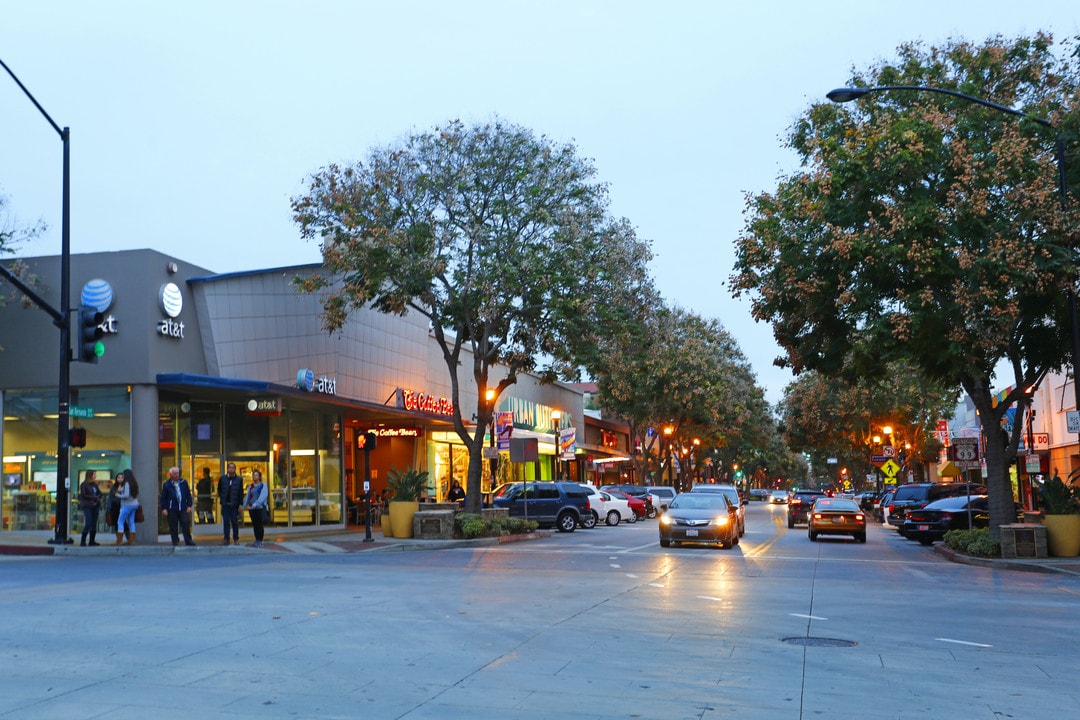
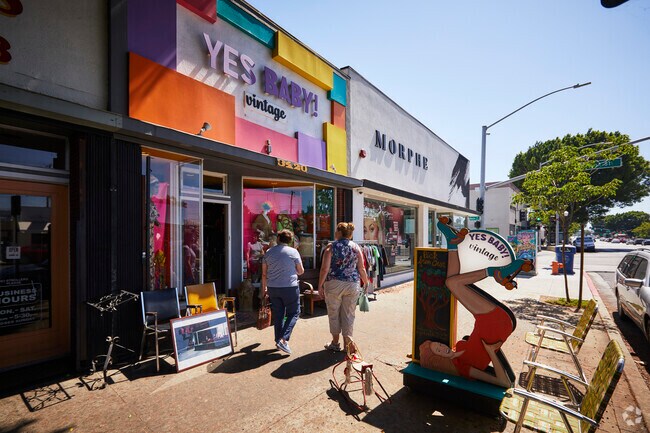
Downtown Burbank offers tons of great shopping destinations.
Median Household Income
$88,852
Average: $114,448
Education
41,174
Residents Have a Degree
Job Market
54,038
Workers Employed
Median Age
42 Years
Largest Age Group
35-44 Years
Approximately 16% of Residents
Under 20
20%
Over 65
18%
Housing Distribution
Burbank has more renters than homeowners.

Education Distribution
Review this city's overall education levels.

As of July 2026, the average apartment rent in Burbank, CA is $1,891 for a studio, $2,245 for one bedroom, $2,940 for two bedrooms, and $4,048 for three bedrooms. Apartment rent in Burbank has increased by 0.2% in the past year.
Explore how walkable, bikeable, drivable, and transit-friendly Burbank, CA is for everyday living.
Moderately Walkable
Walkability
Some Public Transit
Transit
Exceptionally Drivable
Drivability
Fairly Bikeable
Bikeability
Public
Grades K-5
730 Students

Joaquin Miller Elementary School
Public
Grades K-5
730 Students
Thomas Jefferson Elementary School
Public
Grades K-5
758 Students

Public
Grades K-5
758 Students
Public
Grades K-5
591 Students
Public
Grades 6-8
1,353 Students
Public
Grades 6-8
1,353 Students
Public
Grades 6-8
1,030 Students

Public
Grades 6-8
1,030 Students

Public
Grades 6-8
931 Students
Public
Grades 9-12
2,283 Students
Public
Grades 9-12
2,283 Students
Public
Grades 9-12
2,457 Students
Public
Grades 9-12
2,457 Students
Burbank Unified Independent Learning Academy (BUILA)
Public
Grades K-12
140 Students

† Our analysis of utilities, groceries, transportation, healthcare, home prices, and other goods and services is sourced from the Cost of Living Index, a respected benchmark published by the Council for Community and Economic Research (C2ER) that provides a thorough overview of living expenses across different regions.
Rent data is provided by CoStar Group’s Market Trend reports. As the industry leader in commercial real estate information, analytics, and news, CoStar conducts extensive research to produce and maintain a comprehensive database of commercial real estate information. We combine this data with public record to provide the most up-to-date rental information available.
Consumer goods, services, and home prices are sourced from the Cost of Living Index published by the Council for Community and Economic Research (C2ER). The data on this page is updated quarterly. It was last published in June 2026.
Demographic information comes from Neustar and combines detailed address data with U.S. Census and American Community Survey statistics to produce reliable local estimates.


