Published on
As the multifamily market continues to struggle with high vacancy and insufficient demand, June wrapped up a lackluster spring leasing season with year-over-year rent growth flat at 0.8 percent. Rent growth for June this year fell below historical norms for the month and was weaker than the 1.2 percent annual rent growth posted last June.
Since the start of the year, rent growth has hovered between 0.6 percent and 0.8 percent, well below last year’s above 1-percent performance.
Despite the overall plateau, monthly rent growth ticked up slightly by 0.1 percent, and June marked the seventh consecutive month of positive month-over-month rent growth. (Monthly rent growth in May was initially reported as 0.2 percent and has been revised upward to 0.3 percent.)
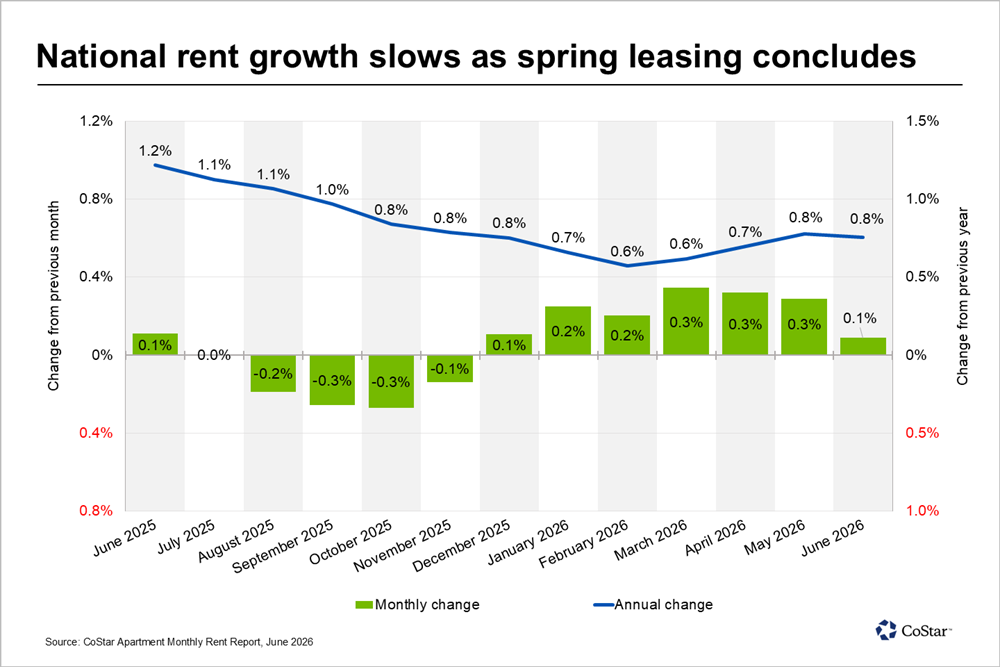
Typically, rent growth momentum picks up during the spring leasing season, which runs from March through June. This period, known for higher-than-average leasing activity, saw much slower growth than typical this year, thanks to weak demand in the face of continuing oversupply conditions.
Tight supply helps Pacific overtake Northeast as rent growth leader
At the regional level, the Midwest maintained its rent growth lead, posting year-over-year rent growth of 2 percent, thanks to its healthy balance of supply and demand. This brought Midwest rent growth to over double the national average.
The Northeast region, previously close behind the Midwest, slipped from second place to third. The Pacific region, where multifamily supply has been the tightest and demand has been on the rise, especially in California, posted rent growth of 1.4 percent, just above the 1.3 percent of the Northeast region.
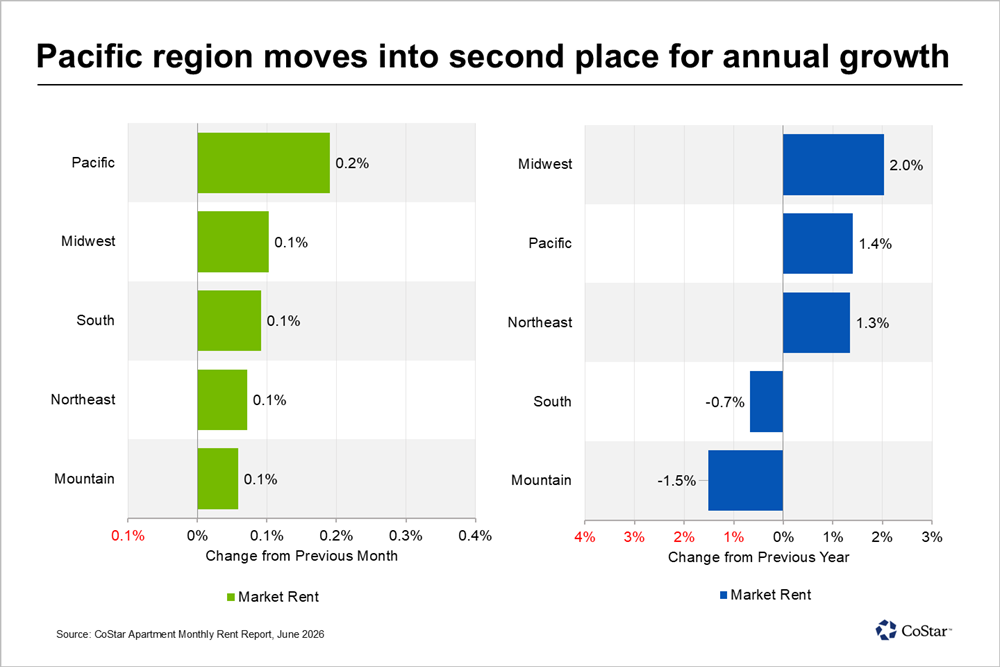
Underperforming the national average were the South and Mountain regions. In the South, rent growth fell by 0.7 percent year over year, and the Mountain region saw a decline of 1.5 percent.
Bay Area markets continue meteoric rise
Rents in the San Francisco Bay Area continued to skyrocket, taking the top spots on both the annual and monthly rent growth charts.
San Francisco, San Jose, and the East Bay took the first, second, and fourth spots for annual rent growth, with 9.2 percent, 5.6 percent, and 3.1 percent rent growth. Rents in these markets also increased month over month, with the three markets taking the top three spots for monthly rent growth, with increases of 0.7 percent, 0.6 percent, and 0.4 percent, respectively.
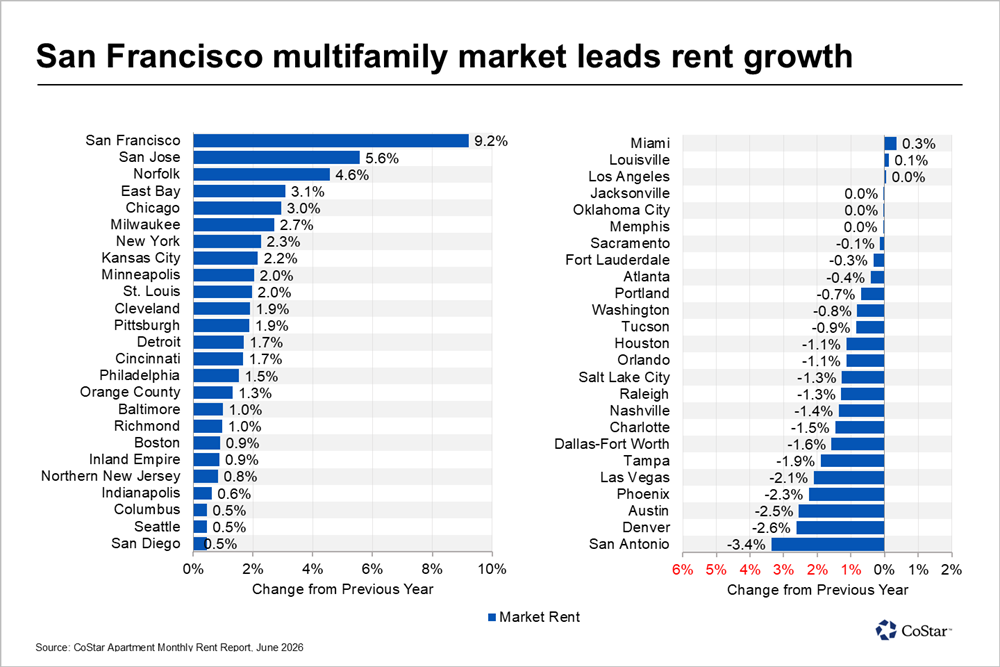
Rents in these markets have benefited from the area’s limited development and tight supply, paired with a demand boom powered by AI growth in the region’s tech sector.
Rounding out the top five, Norfolk, Virginia took the third spot with 4.6 percent rent growth, and Chicago came in fifth at 3 percent rent growth.
Austin no longer the worst-performing multifamily market
After sitting at the bottom of the rent growth charts for nearly three years straight, Austin has finally climbed out of last place. San Antonio, which has faced the highest multifamily vacancy rate in the country, has taken Austin’s place with an annual rent decline of 3.4 percent.
In second-to-last place, Denver saw rents fall by 2.6 percent.
Austin, which has continued to face high vacancy after a flurry of COVID-era construction that at its peak made up 20 percent of total inventory, is now in the third-to-last place with an annual rent decline of 2.5 percent.
Southwest markets Phoenix and Las Vegas took the fourth and fifth spots at the bottom of the chart, with negative 2.3 percent and negative 2.1 percent rent growth, respectively.
Where’s the multifamily market going?
2026 has been marked by subdued rent growth and high multifamily vacancy. When is rent growth expected to regain momentum? Join CoStar’s Grant Montgomery for a upcoming free webinar to explore the year’s performance so far and the latest outlook for the quarters ahead.