Median Age
31 Years
Largest Age Group
20-29 Years
Approximately 19% of Residents
Under 20
29%
Over 65
14%


Avg Rent
$1,346
Population
12,910
Renter Mix
34% Rent
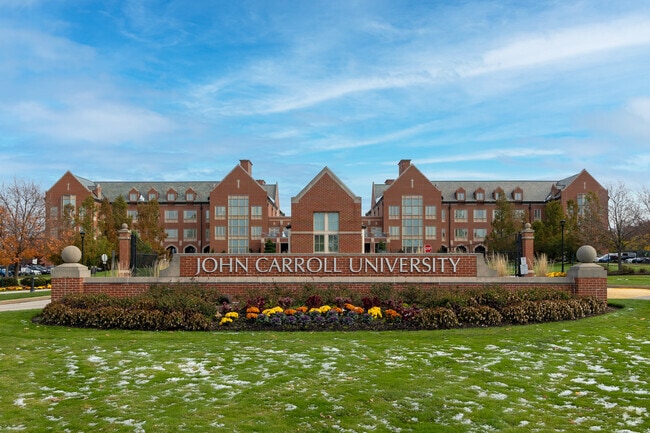
Situated less than ten miles east of Downtown Cleveland, University Heights wears its nickname, the City of Beautiful Homes, as a genuine point of pride. The city spans just two square miles, yet packs in a well-kept, tree-lined character that feels distinct from the sprawl of larger suburbs. John Carroll University anchors the community as both an educational and cultural hub, drawing a steady stream of students, academics, and events like the beloved Summer Band Concerts held right on campus. University Heights shares a school system, library, and several services with neighboring Cleveland Heights, giving residents easy access to a broader range of amenities while still enjoying a close-knit, residential atmosphere.
The housing landscape leans heavily toward well-maintained single-family homes, though renters will also find apartment communities tucked throughout the city, ranging from garden-style buildings to smaller multi-unit residences. The compact size of the city means walkable access to local shops and eateries along Cedar Road and nearby commercial corridors. Each year, the city celebrates its Beautiful Homes Awards, recognizing standout properties for attributes like curb appeal and best front door, which speaks to how seriously residents take the look and feel of their surroundings. For anyone seeking a grounded, accessible suburb with real community character just outside a major metro, University Heights delivers.
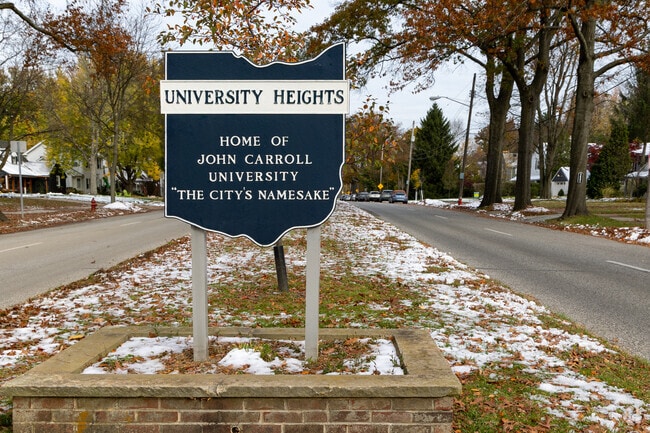
A sign at the entrance of University Heights welcomes residents.
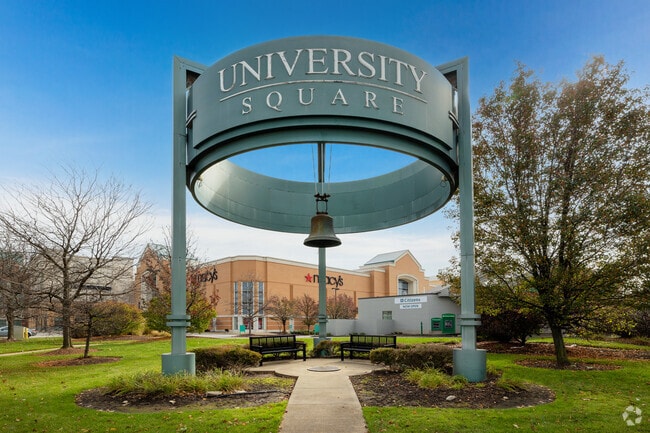
The Freedom Bell outside the University Square shopping center.
Patrons explore shops and restaurants amongst the ornate architecture of Beachwood Place.
Sled riders gather at Cain Park Sledding Hill in University Heights.
Locals enjoy public transportation in University Heights.
The entrance to Walter Stinson Community Park.
Median Household Income
$85,403
Average: $107,727
Education
5,738
Residents Have a Degree
Job Market
6,541
Workers Employed
Median Age
31 Years
Largest Age Group
20-29 Years
Approximately 19% of Residents
Under 20
29%
Over 65
14%
Housing Distribution
University Heights has more homeowners than renters.

Education Distribution
Review this city's overall education levels.

As of July 2026, the average apartment rent in University Heights, OH is $491 for a studio, $1,346 for one bedroom, $1,657 for two bedrooms, and $1,857 for three bedrooms. Apartment rent in University Heights has increased by 8.5% in the past year.
Explore how walkable, bikeable, drivable, and transit-friendly University Heights, OH is for everyday living.
Moderately Walkable
Walkability
Limited Public Transit
Transit
Very Drivable
Drivability
Moderately Bikeable
Bikeability
Lauree P Gearity Elementary School
Public
Grades PK-5
407 Students

Public
Grades 6-8
522 Students
† Our analysis of utilities, groceries, transportation, healthcare, home prices, and other goods and services is sourced from the Cost of Living Index, a respected benchmark published by the Council for Community and Economic Research (C2ER) that provides a thorough overview of living expenses across different regions.
Rent data is provided by CoStar Group’s Market Trend reports. As the industry leader in commercial real estate information, analytics, and news, CoStar conducts extensive research to produce and maintain a comprehensive database of commercial real estate information. We combine this data with public record to provide the most up-to-date rental information available.
Consumer goods, services, and home prices are sourced from the Cost of Living Index published by the Council for Community and Economic Research (C2ER). The data on this page is updated quarterly. It was last published in June 2026.
Demographic information comes from Neustar and combines detailed address data with U.S. Census and American Community Survey statistics to produce reliable local estimates.


