
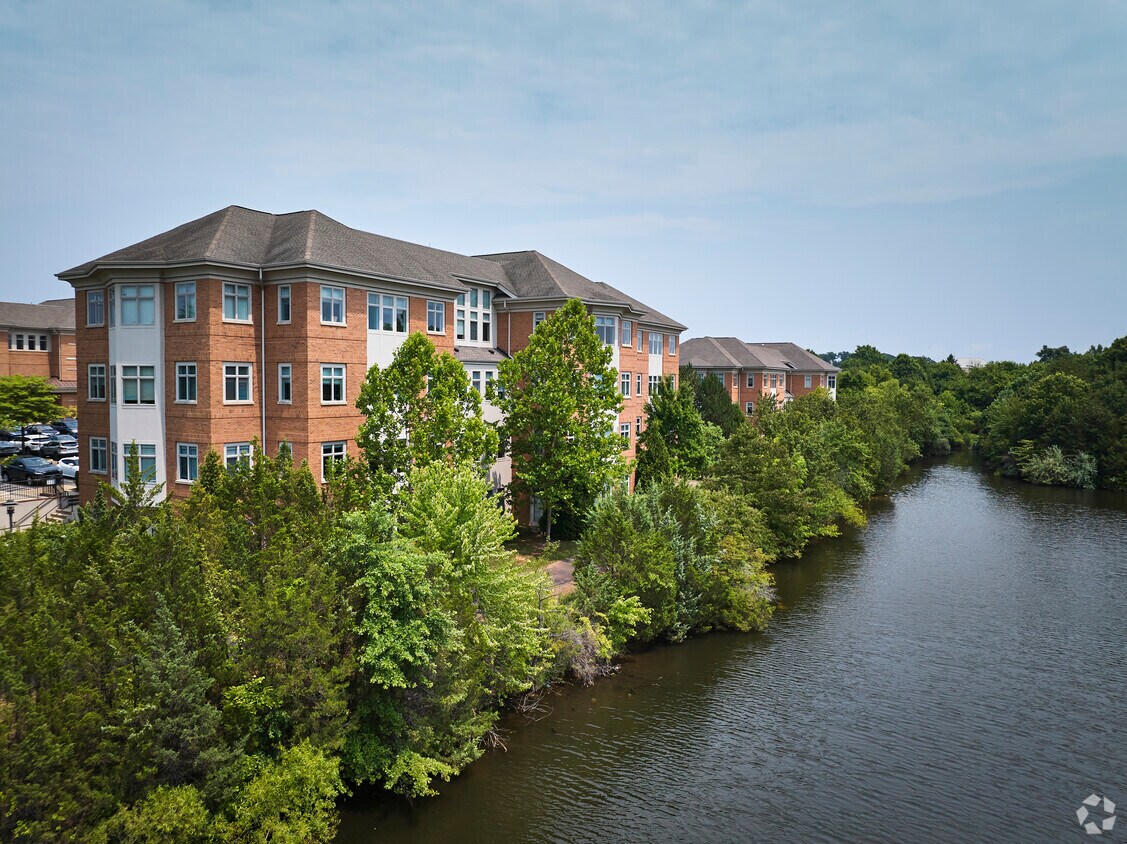
Wyatt
23550 Innovation Ave,
Sterling, VA 20166
$2,023 - $4,278 Total Monthly Price
Studio - 3 Beds


Located in Northern Virginia's technology corridor, Sterling combines suburban living with convenient access to Washington D.C. The area offers various housing options throughout neighborhoods like Sterling Park, Cascades, and Countryside. One-bedroom apartments rent for $2,025 per month, while two-bedroom units average $2,436.
Claude Moore Park spans 357 acres, featuring an indoor pool, hiking trails, and athletic facilities. History buffs can explore Vestal's Gap Road within the park, a historic route dating to colonial times.
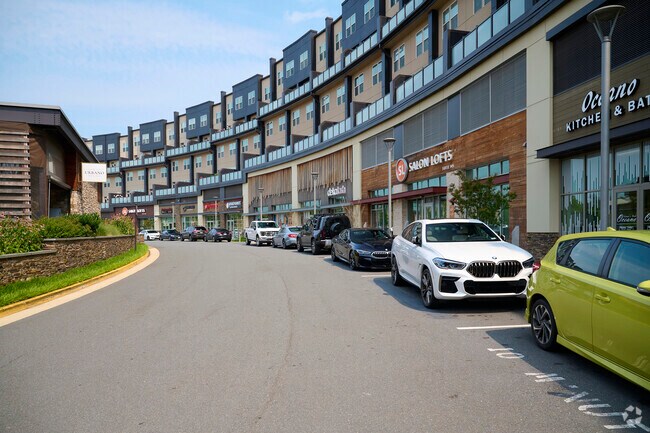
Sterling's proximity to Dulles International Airport has established it as a commercial center. The area is served by multiple public schools, and Northern Virginia Community College maintains a nearby campus. Residents have access to shopping at Dulles Town Center, while Algonkian Regional Park offers riverside recreation along the Potomac.
Sterling has evolved significantly since its dairy farming days of the 1960s, developing into a well-connected suburb that maintains its sense of community. The median household income stands at $113,808, with a population that includes 47.1% Hispanic residents.
Runners love the miles of trails in Potomac Lakes.
Condos and retail outlets in Cascade Overlook Town Center nera Potomac Lakes.
Burtons Grill has delicious food and the atmosphere is cozy and inviting in Sterling.
Enjoy a spectacular view and great food at Bungalow Lakehouse in Sterling neighborhood.
Enjoy a scenic hike along the streams at Millwood Pond in Sterling neighborhood.
Claude Moore Park in Sterling is great for those that love to fish.
As of March 2026, the average apartment rent in Sterling, VA is $1,883 for a studio, $2,044 for one bedroom, $2,450 for two bedrooms, and $3,034 for three bedrooms. Apartment rent in Sterling has increased by 1.4% in the past year.
Explore how walkable, bikeable, drivable, and transit-friendly Sterling, VA is for everyday living.
Fairly walkable
Walkability
Limited public transit
Transit
Moderately drivable
Drivability
Fairly bikeable
Bikeability
Public
Grades PK-5

Public
Grades PK-5

Public
Grades PK-5

Public
Grades PK-5

Public
Grades PK-12
Public
Grades 6-8
Public
Grades PK-12
Public
Grades 6-8

Public
Grades 6-8

Public
Grades PK-12
Public
Grades 9-12

Public
Grades 9-12

3,480
Communities
955,114
Units
894
Cities

47
Communities
9,982
Units
33
Cities

391
Communities
108,446
Units
239
Cities

296
Communities
78,722
Units
170
Cities

64
Communities
14,901
Units
35
Cities

39
Communities
12,087
Units
29
Cities
† Our analysis of utilities, groceries, transportation, healthcare, home prices, and other goods and services is sourced from the Cost of Living Index, a respected benchmark published by the Council for Community and Economic Research (C2ER) that provides a thorough overview of living expenses across different regions.
Rent data is provided by CoStar Group’s Market Trend reports. As the industry leader in commercial real estate information, analytics, and news, CoStar conducts extensive research to produce and maintain a comprehensive database of commercial real estate information. We combine this data with public record to provide the most up-to-date rental information available.
Consumer goods, services, and home prices are sourced from the Cost of Living Index published by the Council for Community and Economic Research (C2ER). The data on this page is updated quarterly. It was last published in February 2026.


