Median Age
39 Years
Largest Age Group
30-39 Years
Approximately 15% of Residents
Under 20
24%
Over 65
18%


Avg Rent
$1,620
Population
112,296
Renter Mix
45% Rent
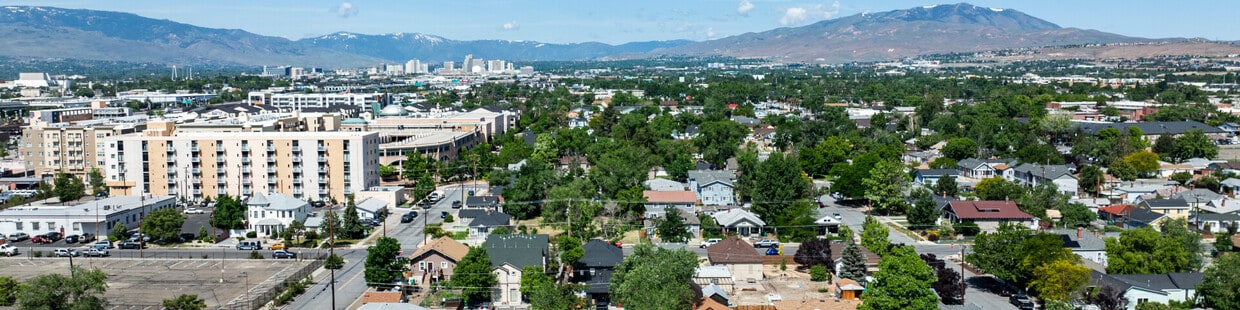
Welcome to Sparks, Nevada, a city rich in railroad heritage and outdoor recreation. Located just east of Reno, Sparks centers around Victorian Square, a pedestrian-friendly downtown district that hosts community celebrations including the annual Best in the West Nugget Rib Cook-off. Residents enjoy activities at Sparks Marina Park, from fishing to walking along waterfront paths. Housing spans from newer developments in Spanish Springs to established neighborhoods near downtown, with current rental rates averaging $1,447 for one-bedroom units and $1,799 for two-bedroom homes, reflecting a 1.8% annual increase.
Home to over 108,000 residents, Sparks combines residential comfort with economic growth, highlighted by Tesla's Gigafactory 1. The city's location provides easy access to Pyramid Lake via Pyramid Way. With sunshine most of the year, residents take advantage of local parks and recreation areas. The Washoe County School District serves the area, and higher education options are available in the region. Since its founding as a railroad town in 1904, Sparks has preserved its historical character while welcoming new development, creating an appealing mix for renters seeking a Nevada address.
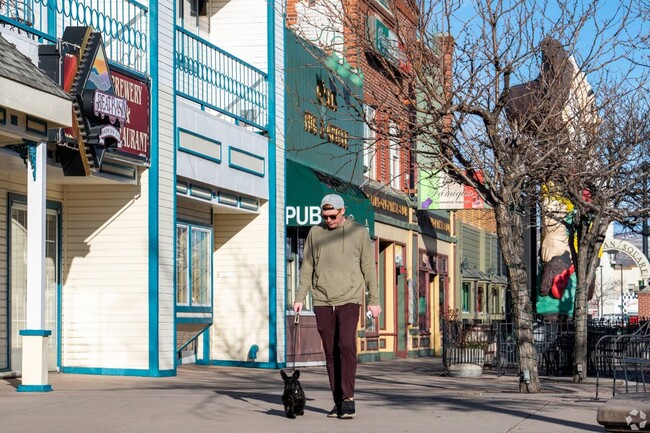
Downtown Sparks is a great place to take a walk with your dog and window shop.
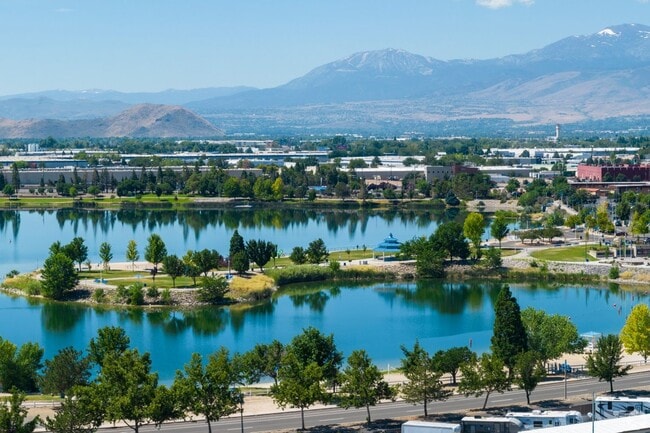
Sparks Marina is a popular spot for fishing and relaxing.
Events in Sparks, like the Nugget Rib Cook Off, last all day.
Median Household Income
$78,778
Average: $94,548
Education
26,751
Residents Have a Degree
Job Market
58,871
Workers Employed
Median Age
39 Years
Largest Age Group
30-39 Years
Approximately 15% of Residents
Under 20
24%
Over 65
18%
Housing Distribution
Sparks has more homeowners than renters.

Education Distribution
Review this city's overall education levels.

As of July 2026, the average apartment rent in Sparks, NV is $1,286 for a studio, $1,620 for one bedroom, $2,007 for two bedrooms, and $2,529 for three bedrooms. Apartment rent in Sparks has increased by 7.8% in the past year.
The cost of living in Sparks, NV is 3.9% higher than the national average. Generally, housing in Sparks is 18.8% more expensive than the national average, with rent falling between $1,286 - $2,529. You can expect to pay 2.9% more for groceries, 22.3% less for utilities, and 16.3% more for transportation.
Compare Cities
Explore how walkable, bikeable, drivable, and transit-friendly Sparks, NV is for everyday living.
Not Walkable
Walkability
Exceptionally Drivable
Drivability
Very Bikeable
Bikeability
Spanish Springs Elementary School
Public
Grades PK-5
558 Students

Public
Grades PK-5
686 Students

Public
Grades PK-5
571 Students
Public
Grades PK-5
480 Students
Alyce Savage Taylor Elementary School
Public
Grades PK-5
469 Students
Public
Grades 6-8
964 Students
Public
Grades 6-8
1,206 Students

Public
Grades 6-8
785 Students

George L Dilworth Middle School
Public
Grades 6-8
613 Students
Public
Grades 6-8
622 Students

Public
Grades 9-12
2,131 Students

Public
Grades 9-12
2,092 Students
Public
Grades 9-12
2,008 Students
Public
Grades 9-12
1,211 Students
Public
Grades 9-12
113 Students

† Our analysis of utilities, groceries, transportation, healthcare, home prices, and other goods and services is sourced from the Cost of Living Index, a respected benchmark published by the Council for Community and Economic Research (C2ER) that provides a thorough overview of living expenses across different regions.
Rent data is provided by CoStar Group’s Market Trend reports. As the industry leader in commercial real estate information, analytics, and news, CoStar conducts extensive research to produce and maintain a comprehensive database of commercial real estate information. We combine this data with public record to provide the most up-to-date rental information available.
Consumer goods, services, and home prices are sourced from the Cost of Living Index published by the Council for Community and Economic Research (C2ER). The data on this page is updated quarterly. It was last published in June 2026.
Demographic information comes from Neustar and combines detailed address data with U.S. Census and American Community Survey statistics to produce reliable local estimates.


