Median Age
44 Years
Largest Age Group
35-44 Years
Approximately 14% of Residents
Under 20
19%
Over 65
23%
Area Guide
Avg Rent
$3,271
Population
20,527
Renter Mix
37% Rent
South San Francisco, known locally as "South City," sits between San Bruno Mountain and San Francisco Bay. Once an industrial center, it's now home to numerous biotechnology companies. The rental market offers options at various price points, with average rents ranging from $2,432 for studios to $4,068 for three-bedroom apartments.
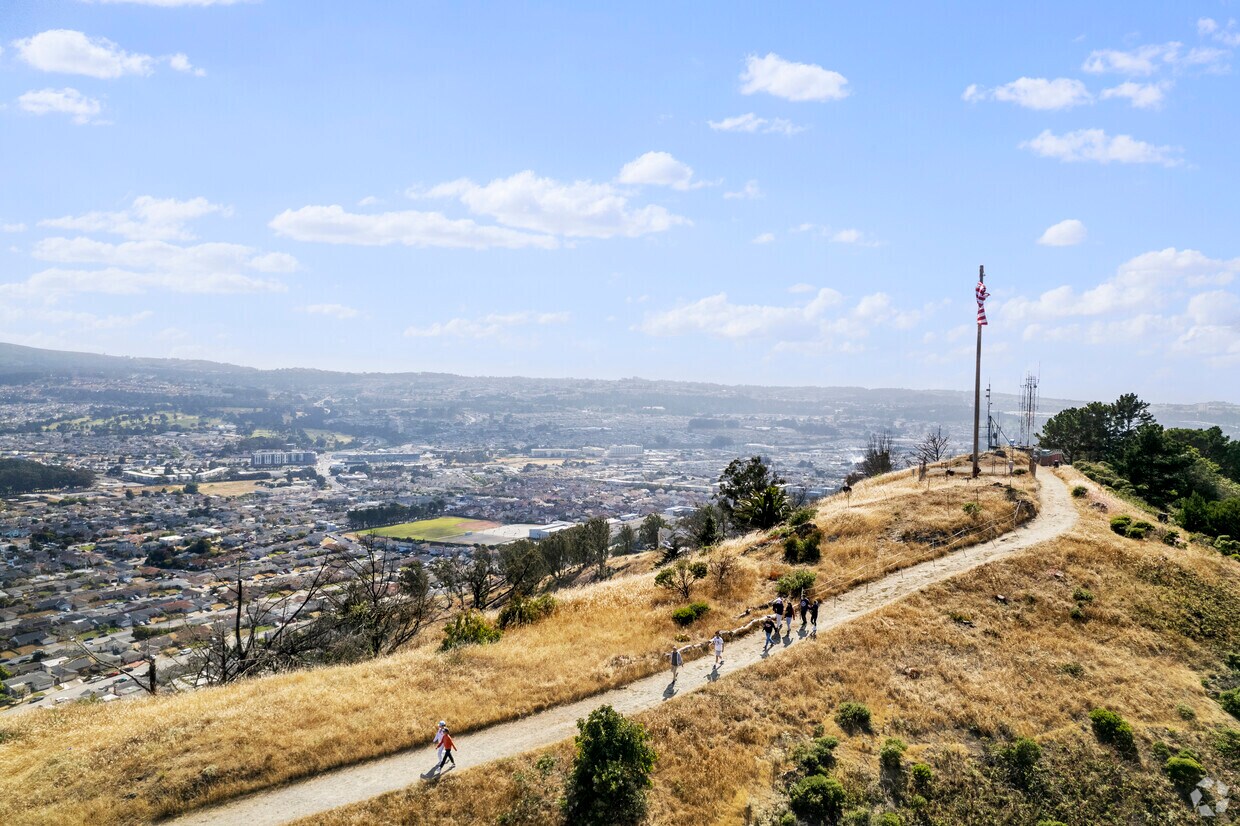
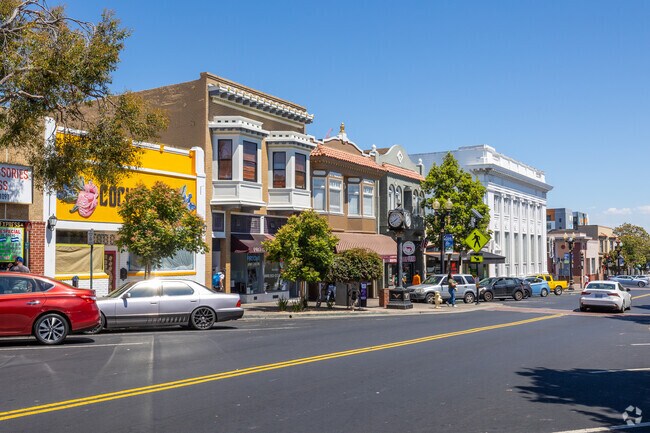
The city's downtown along Grand Avenue features independent shops and local eateries that contribute to its community atmosphere. Sign Hill Park, home to the historic "South San Francisco The Industrial City" sign, provides hiking trails with sweeping views of the bay. Orange Memorial Park offers recreational facilities, including a swimming pool and seasonal farmers' market. East of Highway 101, the city has developed into a biotechnology research center, with Genentech's campus serving as a major employer. The Westborough and Buri Buri neighborhoods feature established residential areas, while newer apartment communities have sprung up near the South San Francisco BART station, offering convenient access throughout the Bay Area. The mild climate and proximity to San Francisco International Airport add to the area's appeal.
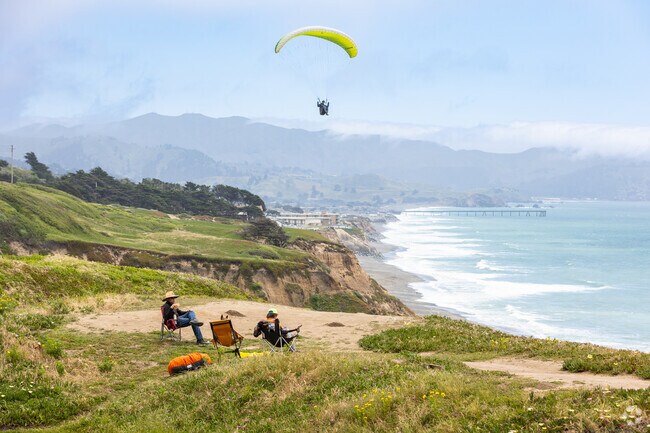
The Pacific coastline appeals to adventurers of all types.
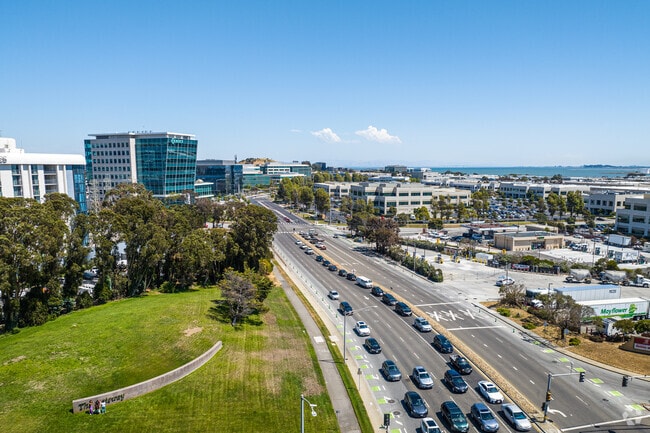
Oyster Point is a busy hub for industry in South San Francisco.
Median Household Income
$132,000
Average: $159,004
Education
7,591
Residents Have a Degree
Job Market
11,424
Workers Employed
Median Age
44 Years
Largest Age Group
35-44 Years
Approximately 14% of Residents
Under 20
19%
Over 65
23%
Housing Distribution
South San Francisco has more homeowners than renters.

Education Distribution
Review this city's overall education levels.

As of July 2026, the average apartment rent in South San Francisco, CA is $2,606 for a studio, $3,271 for one bedroom, $3,787 for two bedrooms, and $4,256 for three bedrooms. Apartment rent in South San Francisco has increased by 9.0% in the past year.
Explore how walkable, bikeable, drivable, and transit-friendly South San Francisco, CA is for everyday living.
Fairly Walkable
Walkability
Some Public Transit
Transit
Exceptionally Drivable
Drivability
Fairly Bikeable
Bikeability
Public
Grades K-5
584 Students

Public
Grades K-5
584 Students

Public
Grades K-5
359 Students
Public
Grades K-5
359 Students

Public
Grades K-5
329 Students
Public
Grades 6-8
498 Students
Public
Grades 6-8
652 Students

Public
Grades 6-8
652 Students

Public
Grades 6-8
498 Students
Public
Grades 6-8
573 Students

Public
Grades 9-12
1,053 Students

Public
Grades 9-12
1,053 Students
South San Francisco High School
Public
Grades 9-12
1,239 Students
Public
Grades 9-12
1,239 Students
Baden High (Continuation) School
Public
Grades 9-12
130 Students
† Our analysis of utilities, groceries, transportation, healthcare, home prices, and other goods and services is sourced from the Cost of Living Index, a respected benchmark published by the Council for Community and Economic Research (C2ER) that provides a thorough overview of living expenses across different regions.
Rent data is provided by CoStar Group’s Market Trend reports. As the industry leader in commercial real estate information, analytics, and news, CoStar conducts extensive research to produce and maintain a comprehensive database of commercial real estate information. We combine this data with public record to provide the most up-to-date rental information available.
Consumer goods, services, and home prices are sourced from the Cost of Living Index published by the Council for Community and Economic Research (C2ER). The data on this page is updated quarterly. It was last published in June 2026.
Demographic information comes from Neustar and combines detailed address data with U.S. Census and American Community Survey statistics to produce reliable local estimates.


