Median Age
42 Years
Largest Age Group
35-44 Years
Approximately 15% of Residents
Under 20
20%
Over 65
20%
Avg Rent
$2,858
Population
40,342
Renter Mix
44% Rent
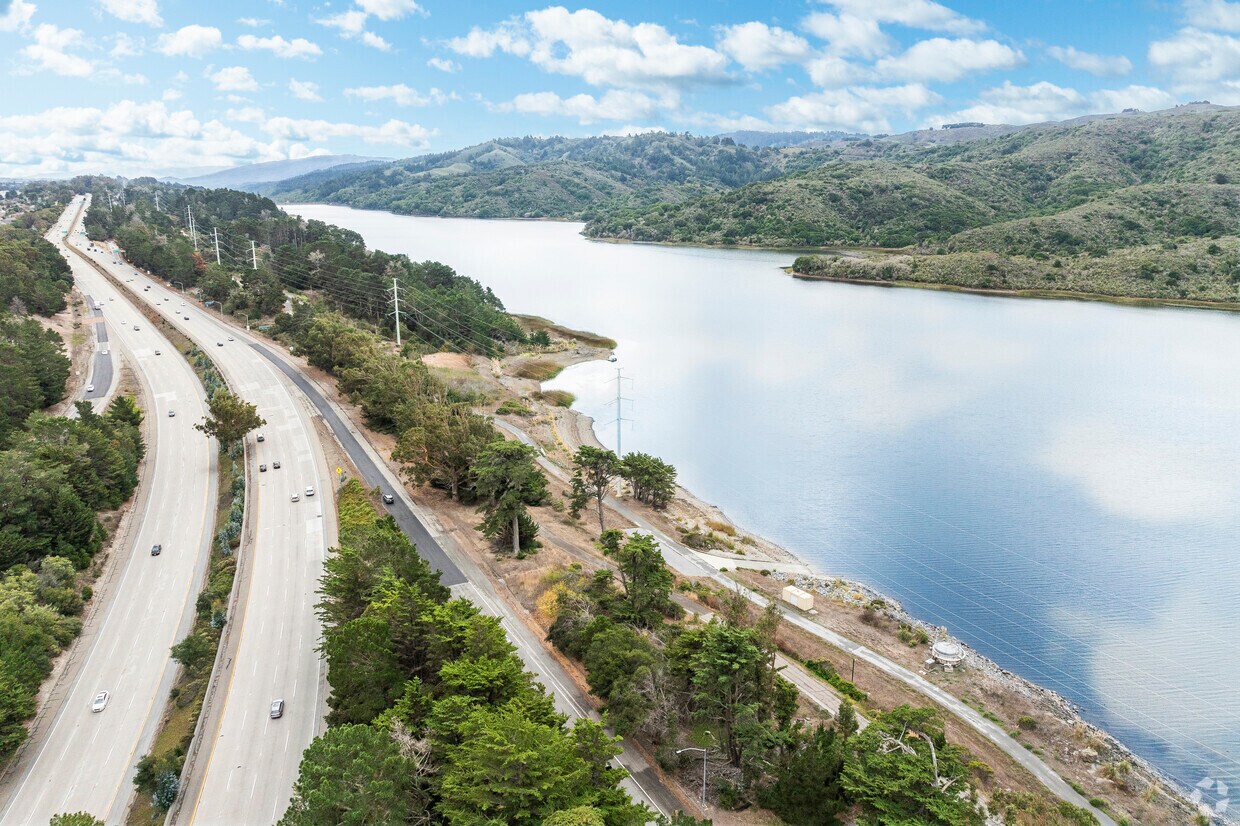
San Bruno sits just 12 miles south of San Francisco in San Mateo County, occupying a compact six square miles where Bay flatlands give way to the foothills of the Santa Cruz Mountains. The city has a grounded, workaday character shaped by its proximity to San Francisco International Airport and its status as the global headquarters of YouTube, which stands as the city's largest employer. That tech anchor, combined with easy access to the broader Peninsula job market, gives San Bruno a steady economic foundation without the overwhelming density of its larger neighbors.
Residential streets run through a mix of established and quieter hillside pockets, giving renters a range of settings to consider. The rental market reflects the city's Peninsula location, with apartment communities, garden-style buildings, and smaller complexes making up most of the available stock. Larger units and townhome-style rentals also appear throughout the city. San Bruno developed rapidly after the 1906 San Francisco earthquake drew residents south, and it became an incorporated city in 1914. BART and Caltrain both serve the area, keeping San Francisco and Silicon Valley within reasonable reach for those who work beyond city limits.
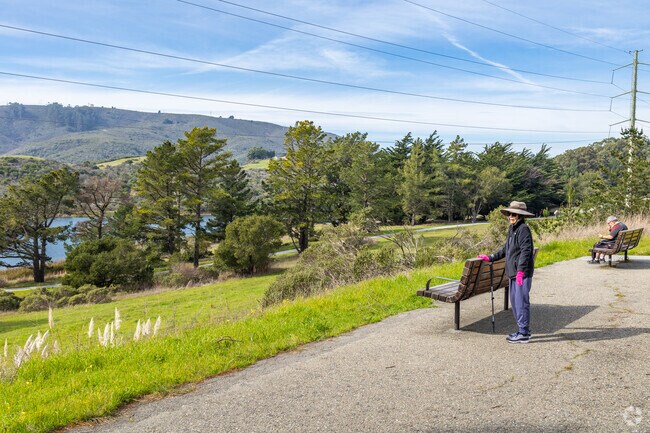
Mills Park is a quiet neighborhood with quick access to abundant nature.
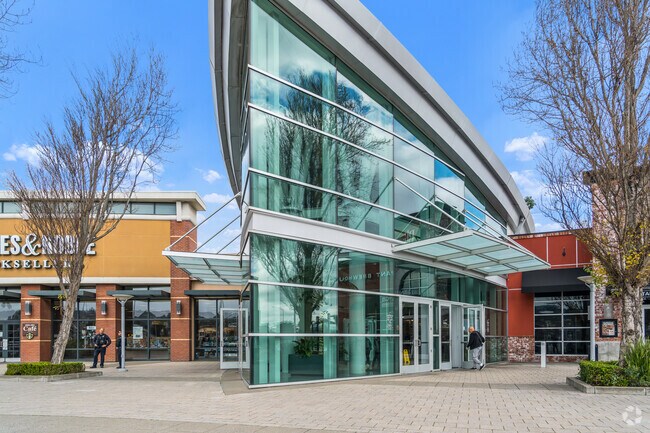
The modern architecture of Tanforan Mall enhances the shopping experience near Mills Park.
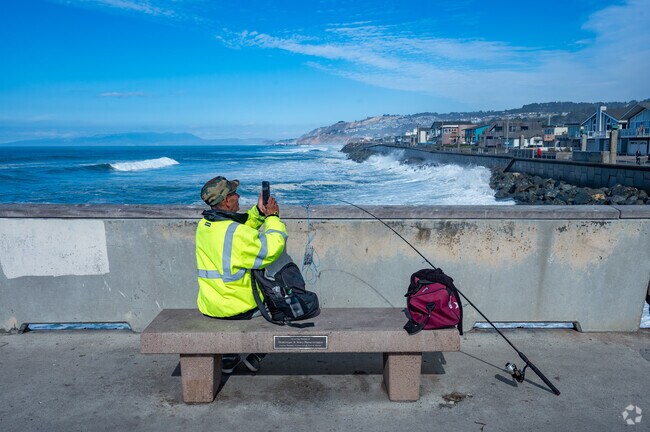
Golfer swings with a sea breeze at Sharp Park Golf Course, Pacific Heights.
Median Household Income
$121,956
Average: $143,941
Education
15,390
Residents Have a Degree
Job Market
23,273
Workers Employed
Median Age
42 Years
Largest Age Group
35-44 Years
Approximately 15% of Residents
Under 20
20%
Over 65
20%
Housing Distribution
San Bruno has more homeowners than renters.

Education Distribution
Review this city's overall education levels.

As of July 2026, the average apartment rent in San Bruno, CA is $2,786 for a studio, $2,857 for one bedroom, $3,798 for two bedrooms, and $5,031 for three bedrooms. Apartment rent in San Bruno has increased by 2.5% in the past year.
Explore how walkable, bikeable, drivable, and transit-friendly San Bruno, CA is for everyday living.
Fairly Walkable
Walkability
Limited Public Transit
Transit
Exceptionally Drivable
Drivability
Fairly Bikeable
Bikeability
Public
Grades K-5
517 Students

Public
Grades K-5
486 Students
Public
Grades K-5
486 Students
Public
Grades K-5
517 Students

Allen (Decima M.) Elementary School
Public
Grades K-5
396 Students

Public
Grades 6-8
491 Students

Public
Grades 6-8
491 Students
Public
Grades 9-12
1,061 Students

Public
Grades 9-12
1,061 Students
Five Keys Charter (SF Sheriff'S) School
Public
Grades 9-12
201 Students

† Our analysis of utilities, groceries, transportation, healthcare, home prices, and other goods and services is sourced from the Cost of Living Index, a respected benchmark published by the Council for Community and Economic Research (C2ER) that provides a thorough overview of living expenses across different regions.
Rent data is provided by CoStar Group’s Market Trend reports. As the industry leader in commercial real estate information, analytics, and news, CoStar conducts extensive research to produce and maintain a comprehensive database of commercial real estate information. We combine this data with public record to provide the most up-to-date rental information available.
Consumer goods, services, and home prices are sourced from the Cost of Living Index published by the Council for Community and Economic Research (C2ER). The data on this page is updated quarterly. It was last published in June 2026.
Demographic information comes from Neustar and combines detailed address data with U.S. Census and American Community Survey statistics to produce reliable local estimates.


