Median Age
45 Years
Largest Age Group
60-69 Years
Approximately 14% of Residents
Under 20
20%
Over 65
23%
Area Guide
Avg Rent
$2,851
Population
35,530
Renter Mix
32% Rent
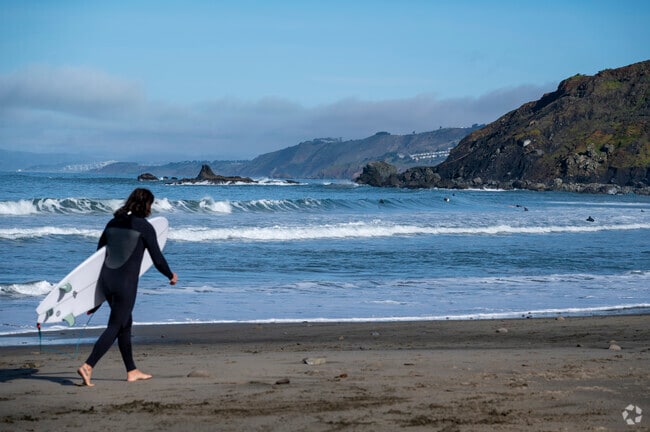
Perched along the San Mateo County coastline between San Francisco and Half Moon Bay, Pacifica trades city noise for crashing waves and fog-laced hillsides. Daily life here revolves around the outdoors — whether that’s surfing at Rockaway Beach, hiking the trails of San Pedro Valley Park, or exploring the ridgelines of Sweeney Ridge, where an expedition first spotted San Francisco Bay in 1769. The arts scene punches above its weight for a city this size, with live music, theater, and gallery events throughout the year.
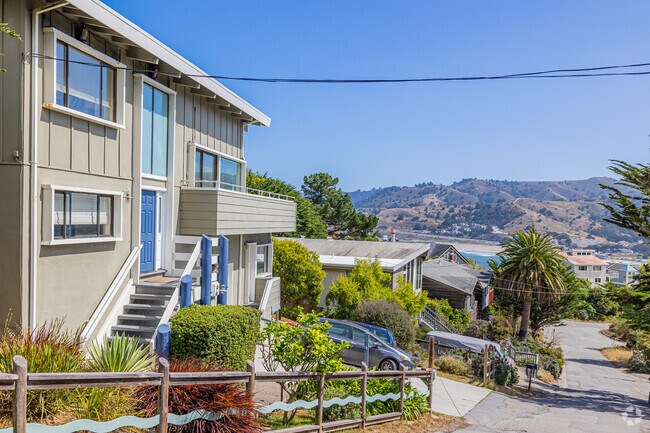
Shops and eateries are woven through Pacifica’s distinct pockets, including the beach-adjacent Rockaway Beach neighborhood and the more residential Sharp Park area. San Francisco is a quick 20-minute drive north on Interstate 280, putting a world-class city within easy reach for commuting and nights out. Renters will find a mix of apartment communities, townhomes, and smaller multi-unit buildings — many offering ocean views or wooded surroundings that feel worlds away from the congestion of the broader Bay Area.
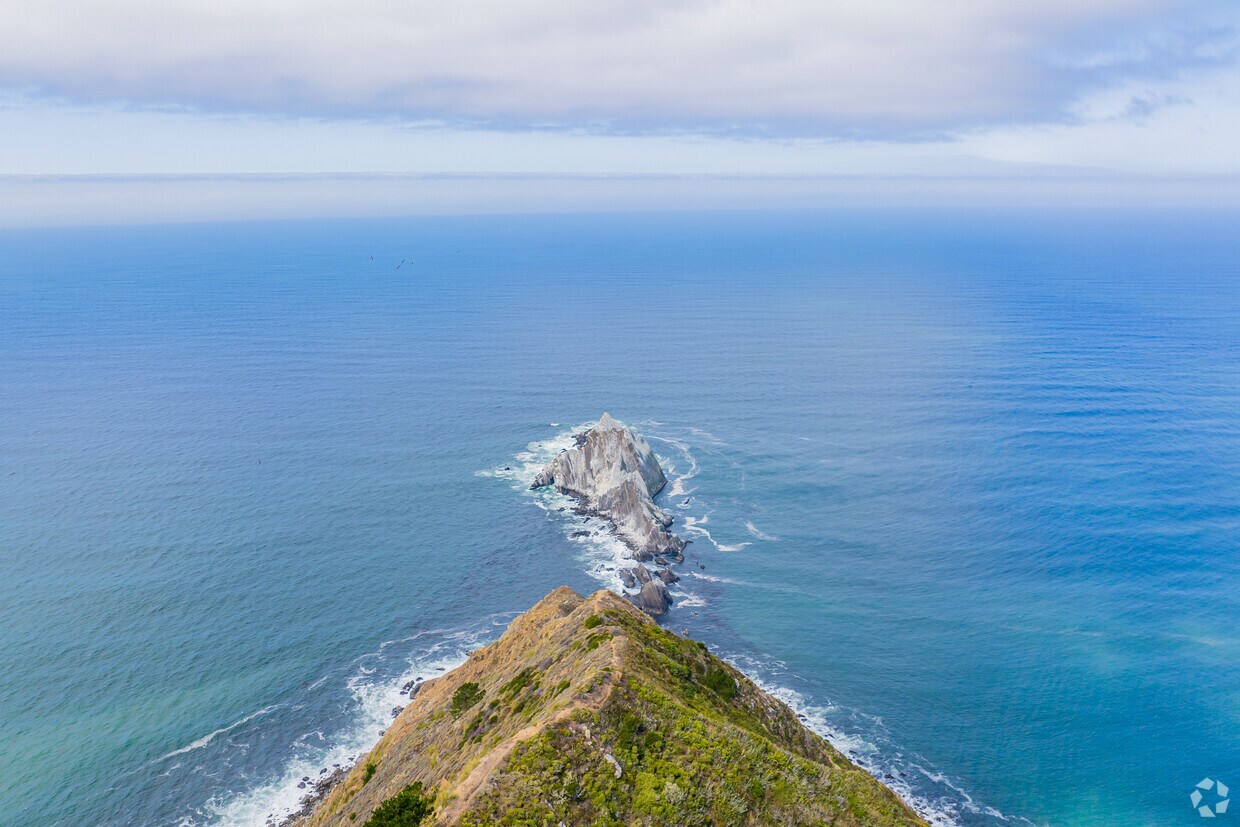
Most of the homes in Pedro Point have an ocean view.
Pacifica's Linda Mar is regarded as the "best surfing spot in the world."
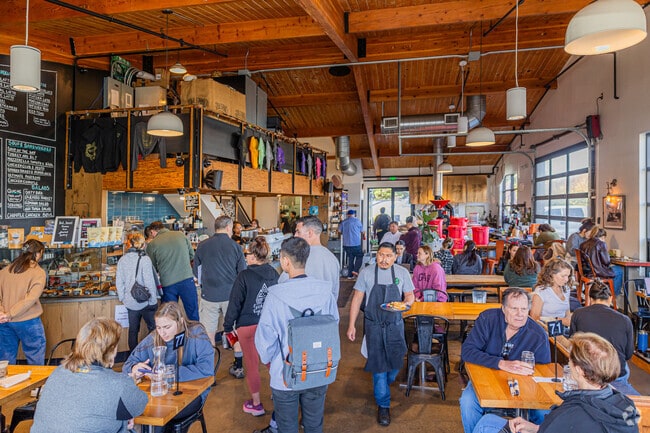
Pedro Point's cafes are local social hubs.
Homes perch on Pedro Point's cliffs, embracing wild ocean views.
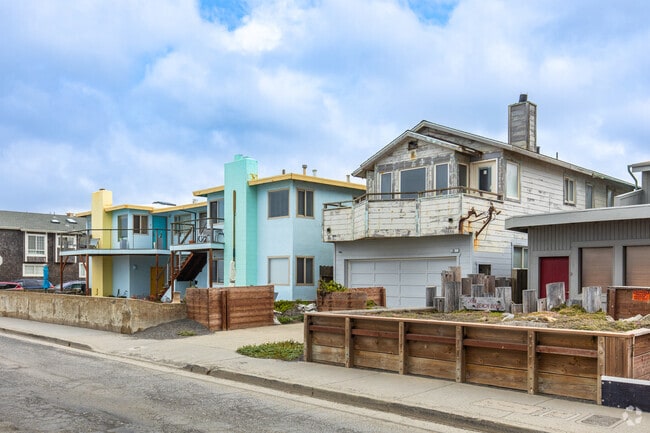
Sharp Park has stunning views of the Pacific Ocean and an abundance of nature’s wonders.
Pacifica's Sharp Park is a bountiful seaside neighborhood of San Francisco.
Median Household Income
$136,933
Average: $159,398
Education
14,402
Residents Have a Degree
Job Market
19,678
Workers Employed
Median Age
45 Years
Largest Age Group
60-69 Years
Approximately 14% of Residents
Under 20
20%
Over 65
23%
Housing Distribution
Pacifica has more homeowners than renters.

Education Distribution
Review this city's overall education levels.

As of July 2026, the average apartment rent in Pacifica, CA is $2,940 for a studio, $2,850 for one bedroom, $3,309 for two bedrooms, and $2,465 for three bedrooms. Apartment rent in Pacifica has increased by 6.9% in the past year.
Explore how walkable, bikeable, drivable, and transit-friendly Pacifica, CA is for everyday living.
Somewhat Walkable
Walkability
Very Drivable
Drivability
Moderately Bikeable
Bikeability
Public
Grades K-5
404 Students

Public
Grades K-5
404 Students
Public
Grades K-8
368 Students
Public
Grades K-8
368 Students
Public
Grades K-8
524 Students

Public
Grades K-8
368 Students
Public
Grades K-8
368 Students
Public
Grades K-8
524 Students
Public
Grades K-8
524 Students
Public
Grades K-8
500 Students
Public
Grades 9-12
740 Students
Public
Grades 9-12
740 Students
Public
Grades 9-12
471 Students
† Our analysis of utilities, groceries, transportation, healthcare, home prices, and other goods and services is sourced from the Cost of Living Index, a respected benchmark published by the Council for Community and Economic Research (C2ER) that provides a thorough overview of living expenses across different regions.
Rent data is provided by CoStar Group’s Market Trend reports. As the industry leader in commercial real estate information, analytics, and news, CoStar conducts extensive research to produce and maintain a comprehensive database of commercial real estate information. We combine this data with public record to provide the most up-to-date rental information available.
Consumer goods, services, and home prices are sourced from the Cost of Living Index published by the Council for Community and Economic Research (C2ER). The data on this page is updated quarterly. It was last published in June 2026.
Demographic information comes from Neustar and combines detailed address data with U.S. Census and American Community Survey statistics to produce reliable local estimates.


