Median Age
39 Years
Largest Age Group
35-44 Years
Approximately 16% of Residents
Under 20
24%
Over 65
16%


Avg Rent
$1,795
Population
112,921
Renter Mix
49% Rent
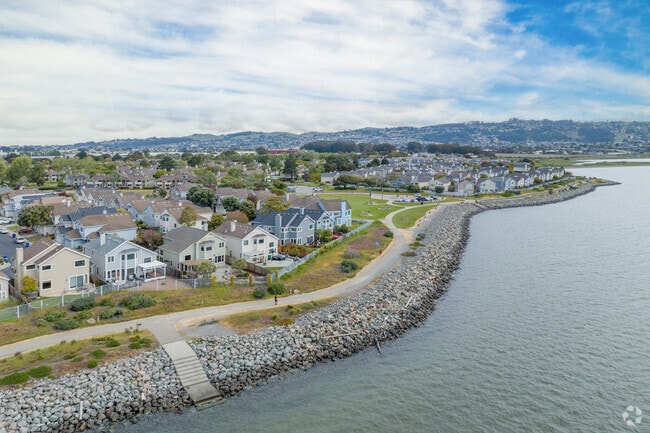
Richmond sits on the shores of both San Francisco Bay and San Pablo Bay, giving it a waterfront character that sets it apart from most Bay Area cities its size. Point Richmond draws weekend explorers with its walkable historic streets, local shops, and Keller Beach, while Marina Bay offers scenic shoreline paths and the ferry terminal with a direct ride to San Francisco's Ferry Building. Nature lovers get serious mileage here too, with Wildcat Canyon Regional Park, Miller/Knox Regional Shoreline, and Point Pinole all within easy reach. The Rosie the Riveter/WWII Home Front National Historical Park tells a compelling chapter of American history right along the waterfront.
Richmond's rental market gives renters solid variety, from classic bungalow-style units and garden-court apartment communities to newer waterfront condos near Marina Bay. The Richmond BART and Amtrak station makes car-free commuting to Oakland and San Francisco straightforward, while drivers enjoy quick access to I-80, I-580, and the Richmond–San Rafael Bridge into Marin County. Whether you want a quiet residential street near Civic Center Plaza or a spot close to Macdonald Avenue dining, Richmond delivers Bay Area living at a scale that still feels approachable.
Have an afternoon walk with sailboats in the background at the Marina Bay Park in Marina Bay.
Streets in City Central are decorated with beautiful murals.
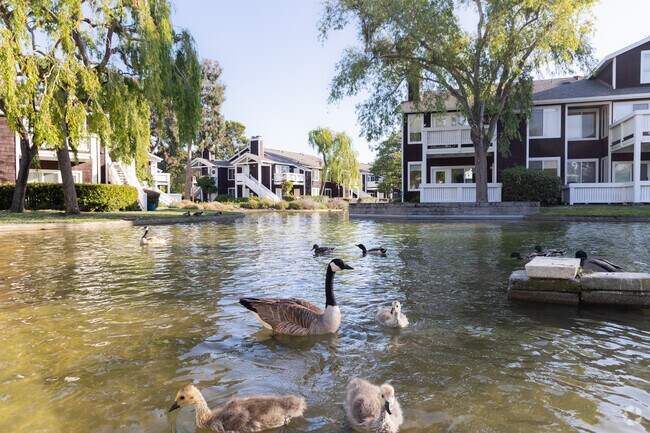
Marina Bay is blessed with frequent sightings of wildlife.
The community garden is well manicured by it's residents in Marina Bay.
The Marina Bay Farmer's Market is a popular place to shop on Saturdays.
3rd of July is the perfect time to watch fireworks if you live in Marina Bay.
Median Household Income
$81,521
Average: $105,321
Education
31,164
Residents Have a Degree
Job Market
58,910
Workers Employed
Median Age
39 Years
Largest Age Group
35-44 Years
Approximately 16% of Residents
Under 20
24%
Over 65
16%
Housing Distribution
In Richmond, there are roughly the same number of renters and homeowners.

Education Distribution
Review this city's overall education levels.

As of July 2026, the average apartment rent in Richmond, CA is $1,122 for a studio, $1,801 for one bedroom, $2,081 for two bedrooms, and $2,512 for three bedrooms. Apartment rent in Richmond has increased by 6.3% in the past year.
Explore how walkable, bikeable, drivable, and transit-friendly Richmond, CA is for everyday living.
Fairly Walkable
Walkability
Some Public Transit
Transit
Exceptionally Drivable
Drivability
Moderately Bikeable
Bikeability
Public
Grades K-8
510 Students

Public
Grades K-8
510 Students
Public
Grades K-12
1,078 Students

Public
Grades K-5
415 Students
Public
Grades K-5
415 Students
Public
Grades K-8
510 Students
Public
Grades K-8
510 Students
Public
Grades K-12
1,078 Students
Public
Grades 6-8
92 Students
Public
Grades 6-8
296 Students

Leadership Public Schools: Richmond
Public
Grades 9-12
546 Students
Public
Grades K-12
1,078 Students
Public
Grades 9-12
333 Students
Public
Grades 9-12
1,047 Students

Public
Grades 9-12
1,280 Students

† Our analysis of utilities, groceries, transportation, healthcare, home prices, and other goods and services is sourced from the Cost of Living Index, a respected benchmark published by the Council for Community and Economic Research (C2ER) that provides a thorough overview of living expenses across different regions.
Rent data is provided by CoStar Group’s Market Trend reports. As the industry leader in commercial real estate information, analytics, and news, CoStar conducts extensive research to produce and maintain a comprehensive database of commercial real estate information. We combine this data with public record to provide the most up-to-date rental information available.
Consumer goods, services, and home prices are sourced from the Cost of Living Index published by the Council for Community and Economic Research (C2ER). The data on this page is updated quarterly. It was last published in June 2026.
Demographic information comes from Neustar and combines detailed address data with U.S. Census and American Community Survey statistics to produce reliable local estimates.


