Median Age
43 Years
Largest Age Group
35-44 Years
Approximately 14% of Residents
Under 20
21%
Over 65
20%

Avg Rent
$2,042
Population
13,724
Renter Mix
36% Rent
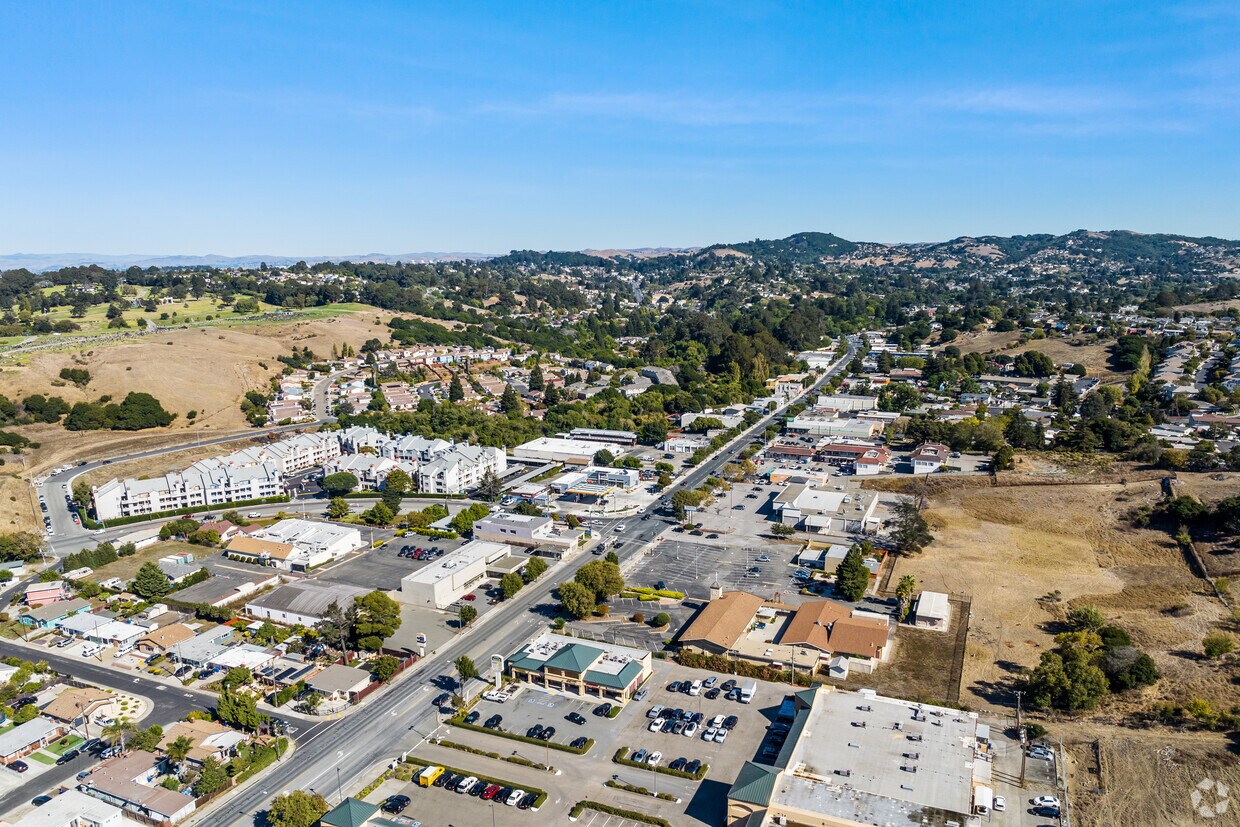
Tucked into the rolling hills of Contra Costa County, El Sobrante sits about 20 miles northwest of San Francisco, offering a quieter pace without losing touch with the Bay Area's energy. The name itself comes from the Spanish word for "surplus," a nod to the original Rancho El Sobrante land grant that once covered this corner of California. Spanning just three square miles, the area carries a close-knit, residential feel while staying well-connected to nearby cities like Richmond and San Pablo via I-80. Kennedy Grove Regional Recreation Area, Wildcat Canyon Regional Park, and the San Pablo Reservoir are all within easy reach, making the outdoors a natural part of everyday life here. The housing mix leans toward single-family homes on tree-lined streets, though renters will also find apartment communities ranging from garden-style units to more spacious multi-bedroom layouts suited to a range of lifestyles. Shopping along San Pablo Dam Road and at the Hilltop Mall in nearby Richmond keeps daily errands manageable. El Sobrante draws those who want room to breathe, scenic surroundings, and a genuine neighborhood feel, all within striking distance of one of the country's most dynamic metro areas.
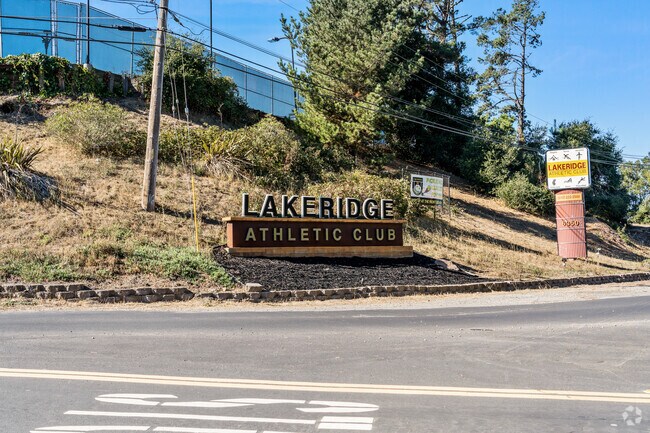
The Lakeridge Athletic Club has a variety of amenities and activities.
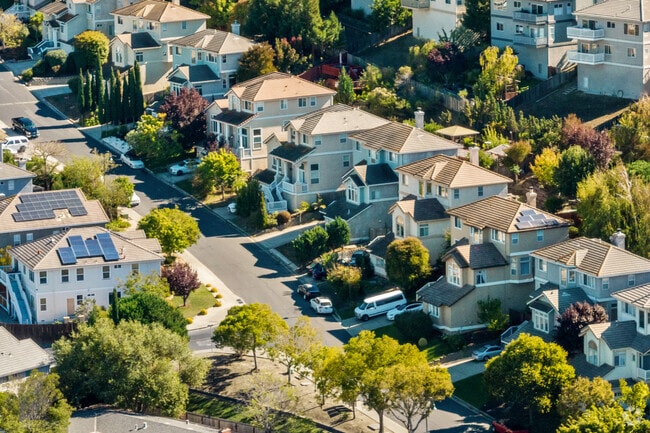
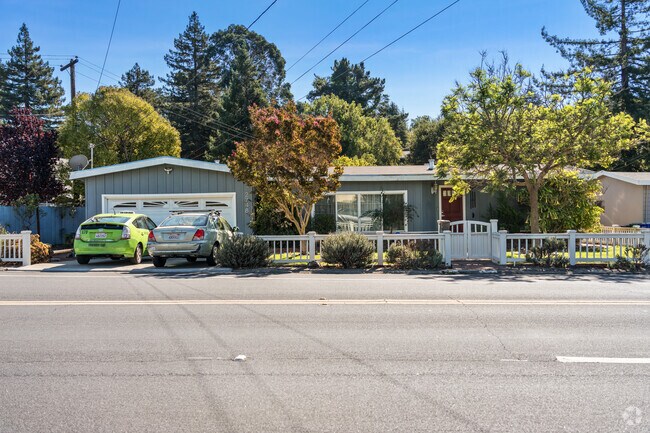
El Sobrante's homes often capitalize on the town's stunning natural surroundings.
El Sobrante provides plenty of green space for residents.
The welcome sign for El Sobrante.
Shops provide residents with access to a wide array of international foods, spices, and products.
Central Foods is a Mexican market with amazing produce.
Median Household Income
$103,015
Average: $124,477
Education
4,681
Residents Have a Degree
Job Market
6,965
Workers Employed
Median Age
43 Years
Largest Age Group
35-44 Years
Approximately 14% of Residents
Under 20
21%
Over 65
20%
Housing Distribution
El Sobrante has more homeowners than renters.

Education Distribution
Review this city's overall education levels.

As of July 2026, the average apartment rent in El Sobrante, CA is $1,427 for a studio, $2,046 for one bedroom, $2,574 for two bedrooms, and $2,490 for three bedrooms. Apartment rent in El Sobrante has increased by 2.2% in the past year.
Explore how walkable, bikeable, drivable, and transit-friendly El Sobrante, CA is for everyday living.
Fairly Walkable
Walkability
Limited Public Transit
Transit
Exceptionally Drivable
Drivability
Fairly Bikeable
Bikeability
Public
Grades K-5
318 Students

Public
Grades K-5
460 Students

Public
Grades 6-8
372 Students

† Our analysis of utilities, groceries, transportation, healthcare, home prices, and other goods and services is sourced from the Cost of Living Index, a respected benchmark published by the Council for Community and Economic Research (C2ER) that provides a thorough overview of living expenses across different regions.
Rent data is provided by CoStar Group’s Market Trend reports. As the industry leader in commercial real estate information, analytics, and news, CoStar conducts extensive research to produce and maintain a comprehensive database of commercial real estate information. We combine this data with public record to provide the most up-to-date rental information available.
Consumer goods, services, and home prices are sourced from the Cost of Living Index published by the Council for Community and Economic Research (C2ER). The data on this page is updated quarterly. It was last published in June 2026.
Demographic information comes from Neustar and combines detailed address data with U.S. Census and American Community Survey statistics to produce reliable local estimates.


