Median Age
44 Years
Largest Age Group
35-44 Years
Approximately 16% of Residents
Under 20
20%
Over 65
22%


Avg Rent
$2,331
Population
25,744
Renter Mix
42% Rent
El Cerrito, CA, takes its name from the Spanish phrase meaning
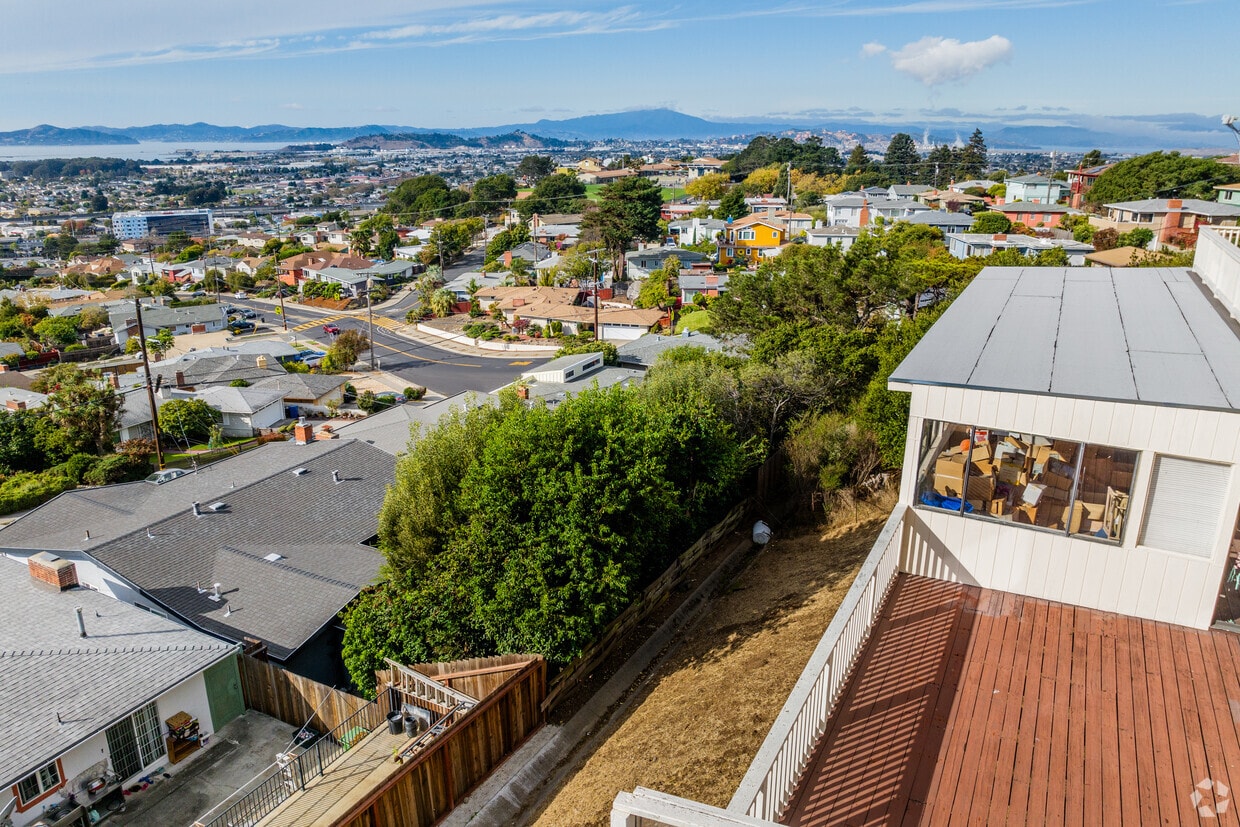
El Cerrito backs up against Wildcat Canyon and trails throughout San Pablo Ridge area.
Whether you need groceries or a freshly prepared meal, the El Cerrito Natural Grocery is great.
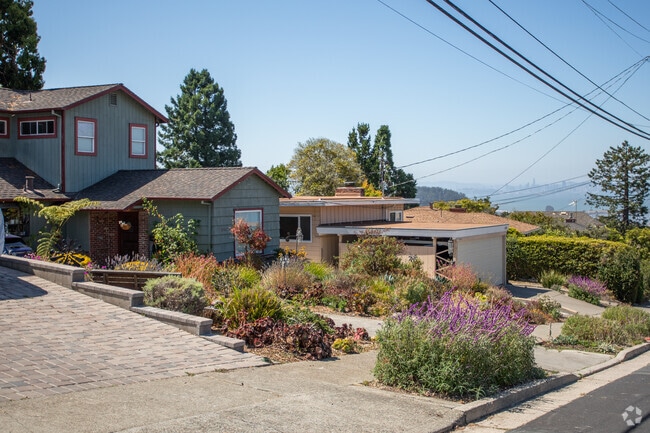
It's common to find a home in El Cerrito North that has views of the Golden Gate Bridge.
Safeway offers organic and fresh produce in El Cerrito North.
Get outside and enjoy the many walking paths in El Cerrito North.
The El Cerrito BART offers great commute options for residents of the Richmond Annex.
Median Household Income
$122,148
Average: $151,050
Education
13,584
Residents Have a Degree
Job Market
13,772
Workers Employed
Median Age
44 Years
Largest Age Group
35-44 Years
Approximately 16% of Residents
Under 20
20%
Over 65
22%
Housing Distribution
El Cerrito has more homeowners than renters.

Education Distribution
Review this city's overall education levels.

As of August 2026, the average apartment rent in El Cerrito, CA is $1,970 for a studio, $2,331 for one bedroom, $2,583 for two bedrooms, and $2,913 for three bedrooms. Apartment rent in El Cerrito has increased by 1.6% in the past year.
Explore how walkable, bikeable, drivable, and transit-friendly El Cerrito, CA is for everyday living.
Fairly Walkable
Walkability
Some Public Transit
Transit
Moderately Drivable
Drivability
Fairly Bikeable
Bikeability
Public
Grades K-5
457 Students

Public
Grades K-5
537 Students

Public
Grades K-5
481 Students
Public
Grades K-5
537 Students

Fred T. Korematsu Middle School
Public
Grades 6-8
708 Students
Public
Grades 6-8
708 Students

Public
Grades 6-12
554 Students
Public
Grades 9-12
1,460 Students

Public
Grades 6-12
554 Students
† Our analysis of utilities, groceries, transportation, healthcare, home prices, and other goods and services is sourced from the Cost of Living Index, a respected benchmark published by the Council for Community and Economic Research (C2ER) that provides a thorough overview of living expenses across different regions.
Rent data is provided by CoStar Group’s Market Trend reports. As the industry leader in commercial real estate information, analytics, and news, CoStar conducts extensive research to produce and maintain a comprehensive database of commercial real estate information. We combine this data with public record to provide the most up-to-date rental information available.
Consumer goods, services, and home prices are sourced from the Cost of Living Index published by the Council for Community and Economic Research (C2ER). The data on this page is updated quarterly. It was last published in June 2026.
Demographic information comes from Neustar and combines detailed address data with U.S. Census and American Community Survey statistics to produce reliable local estimates.


