Median Age
45 Years
Largest Age Group
50-59 Years
Approximately 15% of Residents
Under 20
23%
Over 65
22%

Avg Rent
$2,388
Population
25,474
Renter Mix
35% Rent
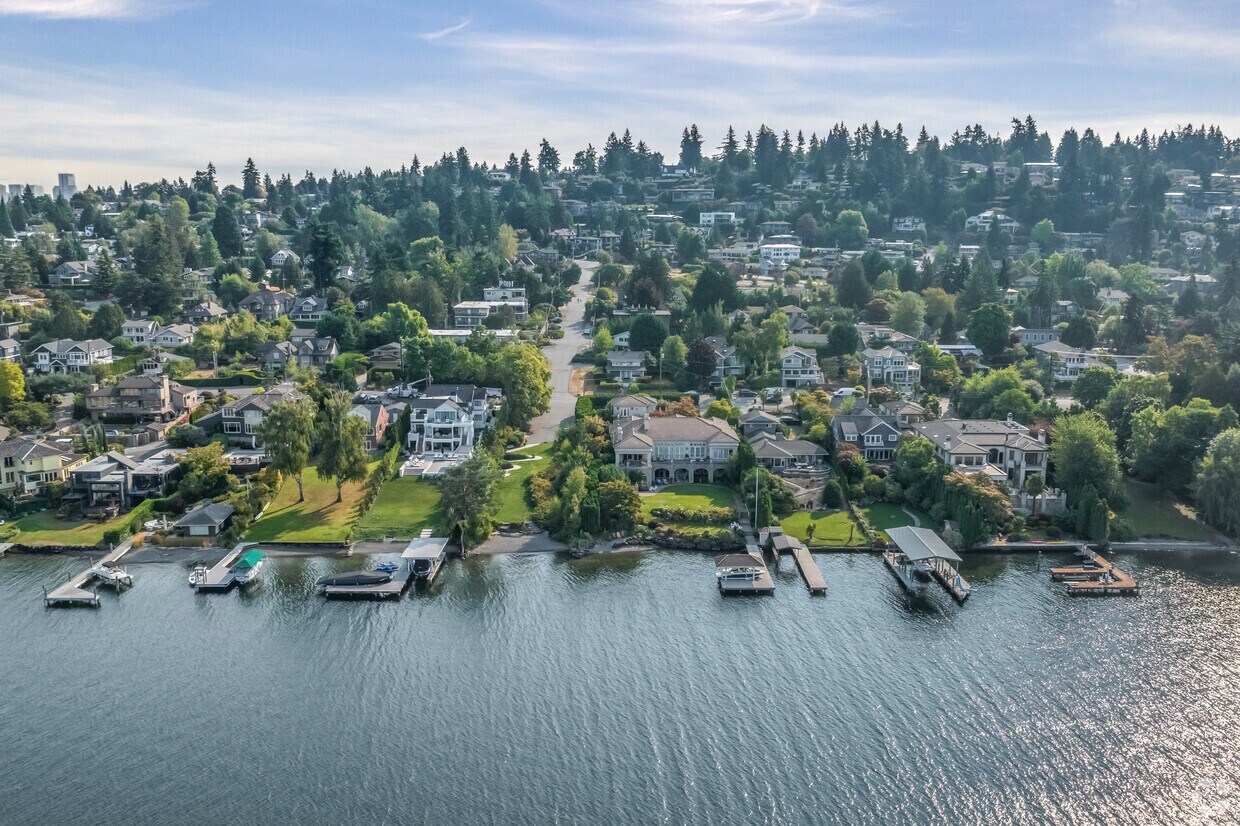
Nestled between Seattle and Bellevue, Mercer Island rests in the southern portion of Lake Washington. Incorporated in 1960, the city is highly regarded for its upscale homes, excellent schools, lush natural beauty, tranquil atmosphere, and miles of developed shoreline.
Mercer Island fosters a strong sense of community through a variety of family-friendly events, such as the Mercer Island Summer Celebration and the Mercer Island Farmers Market, among many others. Residents also bond over a shared love of outdoor recreation at popular venues like Luther Burbank Park, Aubrey Davis Park, and Mercerdale Park. Much of the city’s commercial offerings are clustered near I-90, which connects Mercer Island to the Greater Seattle Area and beyond.
Mercer Island features some of the most stunning waterfront properties in Seattle.
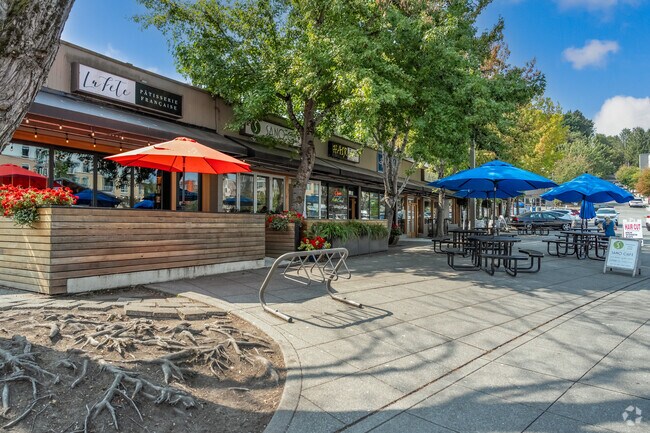
One of Mercer Island's most delicious spots is Feté Patisserie, offering fresh pastries daily.
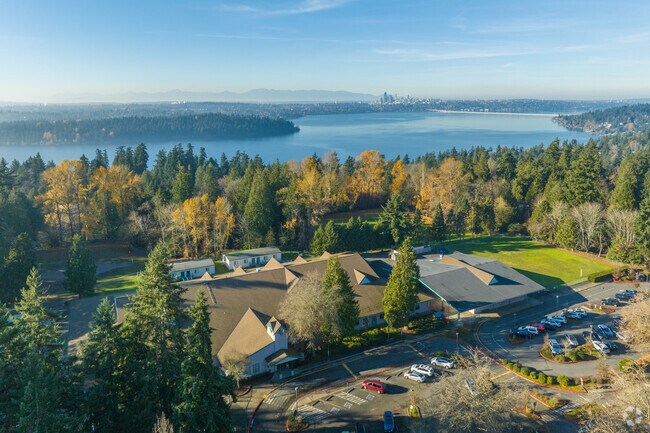
Island Park Elementary School serves students in the Appleton area.
Microsoft has a large presence in Southeast Redmond and is the area's main employer.
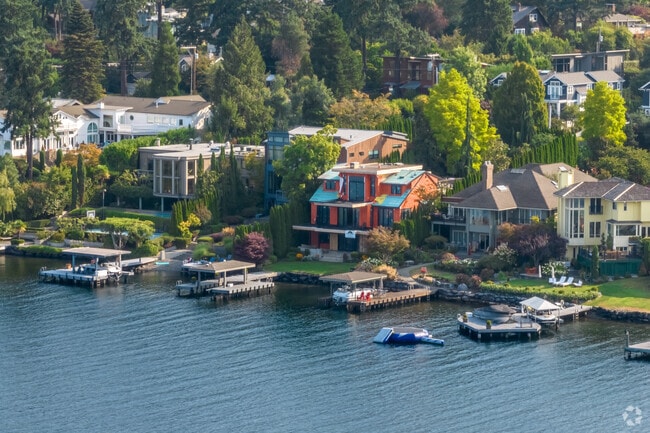
Impressive East Mercer homes sit lakeside looking out towards Bellevue.
Island Books is one of the best bookstores around and is located in Downtown Mercer Island.
Median Household Income
$198,845
Average: $200,588
Education
15,001
Residents Have a Degree
Job Market
12,800
Workers Employed
Median Age
45 Years
Largest Age Group
50-59 Years
Approximately 15% of Residents
Under 20
23%
Over 65
22%
Housing Distribution
Mercer Island has more homeowners than renters.

Education Distribution
Review this city's overall education levels.

As of July 2026, the average apartment rent in Mercer Island, WA is $2,242 for a studio, $2,383 for one bedroom, $3,333 for two bedrooms, and $3,096 for three bedrooms. Apartment rent in Mercer Island has increased by 5.3% in the past year.
Explore how walkable, bikeable, drivable, and transit-friendly Mercer Island, WA is for everyday living.
Somewhat Walkable
Walkability
Limited Public Transit
Transit
Exceptionally Drivable
Drivability
Fairly Bikeable
Bikeability
Public
Grades PK-5
404 Students

Public
Grades K-5
412 Students

Public
Grades K-5
380 Students
Public
Grades K-5
380 Students
Public
Grades K-5
422 Students

Public
Grades 6-8
937 Students
Public
Grades 9-12
1,432 Students
† Our analysis of utilities, groceries, transportation, healthcare, home prices, and other goods and services is sourced from the Cost of Living Index, a respected benchmark published by the Council for Community and Economic Research (C2ER) that provides a thorough overview of living expenses across different regions.
Rent data is provided by CoStar Group’s Market Trend reports. As the industry leader in commercial real estate information, analytics, and news, CoStar conducts extensive research to produce and maintain a comprehensive database of commercial real estate information. We combine this data with public record to provide the most up-to-date rental information available.
Consumer goods, services, and home prices are sourced from the Cost of Living Index published by the Council for Community and Economic Research (C2ER). The data on this page is updated quarterly. It was last published in June 2026.
Demographic information comes from Neustar and combines detailed address data with U.S. Census and American Community Survey statistics to produce reliable local estimates.


