Seattle's Most Pet-Friendly Apartments
Seattle is one of the nation's pet-friendliest cities, and these apartment communities take that role seriously.


Area Guide
Avg Rent
$2,114
Population
757,194
Renter Mix
60% Rent
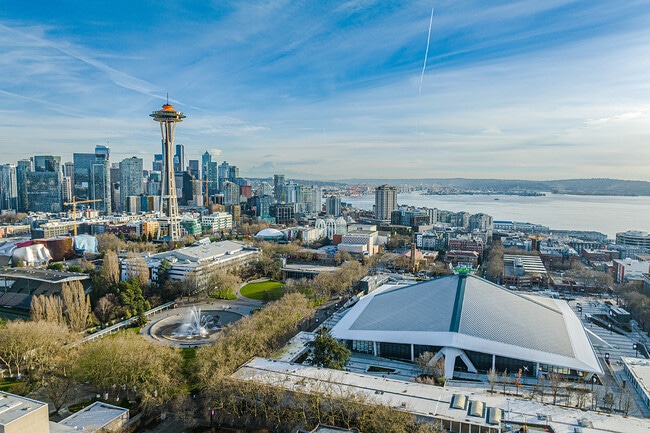
Nestled on the shores of Puget Sound, Seattle is home to glorious mountain views in the distance, making it one of the most scenic metropolitan areas in the nation. Skyscrapers like the Columbia Center and Space Needle grace the city’s skyline, adding to Seattle’s allure. Starbucks, Amazon, and Nordstrom have headquarters in Seattle, so there are plenty of job opportunities in the city. Interstates 5 and 405 and the Seattle-Tacoma International Airport are major benefits for frequent travelers. Residents enjoy exploring the waterfront neighborhoods of Pioneer Square and the famous Pike Place Market for shopping, trendy bars, and restaurants.
Seattle’s art scene is very vibrant, flanked with art galleries, theaters, and sculptures. The city is home to more than 80 music halls and 15 symphony orchestras. Bumbershoot Musical Festival, held every Labor Day Weekend, is one of the world’s largest international music and arts festivals—so don’t miss it this upcoming year! Seattle is the ideal metropolis for residents with an active lifestyle and an interest in parks, hiking, and biking. Check out the trails at Cougar Mountain Wildland Park and Tiger Mountain State Forest after you find your luxury apartment in the city.
Washington Park residents can enjoy a stroll on the Arboretum Loop Trail.
Every Tuesday night during the warm months in Wallingford, Duck Dodge lights up Lake Union.
The UW yacht showing some acrobatic moves at the Opening Day 2024.
The Blue Angels fly past the Space Needle
Lumen Field is home to the Seattle Seahawks
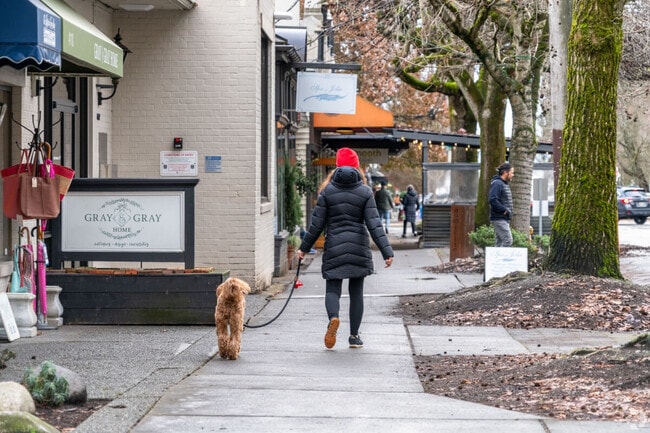
Close to the heart of downtown Seattle, Denny Triangle has many streets worth strolling.
Median Household Income
$114,915
Average: $144,981
Education
422,454
Residents Have a Degree
Job Market
456,652
Workers Employed
Median Age
37 Years
Largest Age Group
30-39 Years
Approximately 22% of Residents
Under 20
19%
Over 65
14%
Housing Distribution
Seattle has more renters than homeowners.

Education Distribution
Review this city's overall education levels.

As of June 2026, the average apartment rent in Seattle, WA is $1,503 for a studio, $2,113 for one bedroom, $2,841 for two bedrooms, and $3,912 for three bedrooms. Apartment rent in Seattle has decreased by -0.4% in the past year.
The cost of living in Seattle, WA is 45.1% higher than the national average. Generally, housing in Seattle is 106.0% more expensive than the national average, with rent falling between $1,503 - $3,912. You can expect to pay 10.7% more for groceries, 0.3% less for utilities, and 34.9% more for transportation.
Compare Cities

Seattle's Most Pet-Friendly Apartments
Seattle is one of the nation's pet-friendliest cities, and these apartment communities take that role seriously.
10 Most Affordable Neighborhoods in Seattle
Looking to live in the Emerald City? Explore the 10 most affordable neighborhoods in Seattle, and find your perfect place without breaking the bank.
10 Best Seattle Neighborhoods for Coffee Lovers
Interested in exploring Seattle’s coffee scene? Here are 10 hotspots of Seattle-style coffee to guide your apartment search.
10 Things Seattle is Known For
Discover what makes the Emerald City shine, from Pike Place Market to national parks. Here are 10 iconic features that make Seattle unique.
10 Most Pet-Friendly Neighborhoods in Seattle, WA
Seattle is one of the most pet-friendly cities in the U.S. and some of its neighborhoods go above and beyond to welcome and include pets. Check out the most pet-friendly neighborhoods in Seattle and why they are known as such.
Explore how walkable, bikeable, drivable, and transit-friendly Seattle, WA is for everyday living.
Exceptionally Walkable
Walkability
Exceptional Public Transit
Transit
Moderately Drivable
Drivability
Moderately Bikeable
Bikeability
Public
Grades K-5
362 Students

Public
Grades K-5
474 Students

Public
Grades K-5
459 Students
Thornton Creek Elementary School
Public
Grades PK-5
456 Students
Public
Grades K-5
454 Students
Public
Grades 6-8
981 Students
Robert Eagle Staff Middle School
Public
Grades 6-8
676 Students
Public
Grades K-8
450 Students
Public
Grades K-8
330 Students
Public
Grades 6-8
1,045 Students

Public
Grades 9-12
1,653 Students
Public
Grades 9-12
1,590 Students
Public
Grades 9-12
1,541 Students
Public
Grades 9-12
1,642 Students
Public
Grades 9-12
1,452 Students
† Our analysis of utilities, groceries, transportation, healthcare, home prices, and other goods and services is sourced from the Cost of Living Index, a respected benchmark published by the Council for Community and Economic Research (C2ER) that provides a thorough overview of living expenses across different regions.
Rent data is provided by CoStar Group’s Market Trend reports. As the industry leader in commercial real estate information, analytics, and news, CoStar conducts extensive research to produce and maintain a comprehensive database of commercial real estate information. We combine this data with public record to provide the most up-to-date rental information available.
Consumer goods, services, and home prices are sourced from the Cost of Living Index published by the Council for Community and Economic Research (C2ER). The data on this page is updated quarterly. It was last published in June 2026.
Demographic information comes from Neustar and combines detailed address data with U.S. Census and American Community Survey statistics to produce reliable local estimates.


