Median Age
44 Years
Largest Age Group
35-44 Years
Approximately 14% of Residents
Under 20
20%
Over 65
22%
Avg Rent
$2,751
Population
24,859
Renter Mix
22% Rent
Located midway between San Francisco and Napa along the coast of San Pablo Bay, Hercules is a stunning waterfront community with a small-town atmosphere, diverse population, and innovative plans for the future. Among Hercules’ exciting planned developments are a new waterfront, town center, and a train and ferry terminal.
Convenience to the San Pablo Bay as well as a host of parks, trails, and athletic programs allows for plenty of recreational activities in Hercules. A peaceful reprieve from city life, Hercules offers residents picturesque homes in quiet neighborhoods with dazzling views of the bay. Shopping opportunities abound at the nearby Shops at Hilltop in addition to several plazas and shopping centers in town. Getting around from Hercules is easy with access to Interstate 80 and State Route 4.
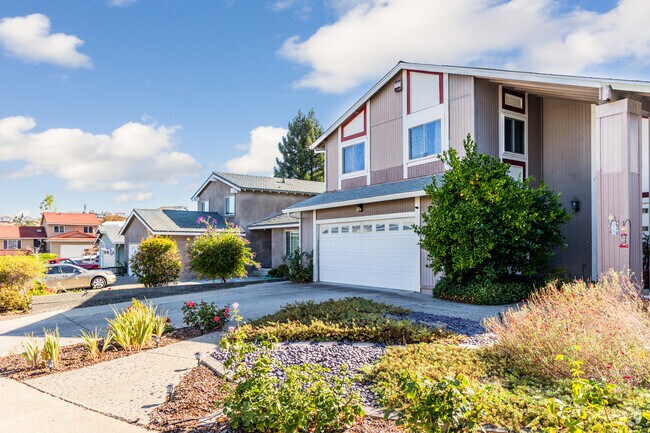
A row of homes nestled in the hills of Hercules
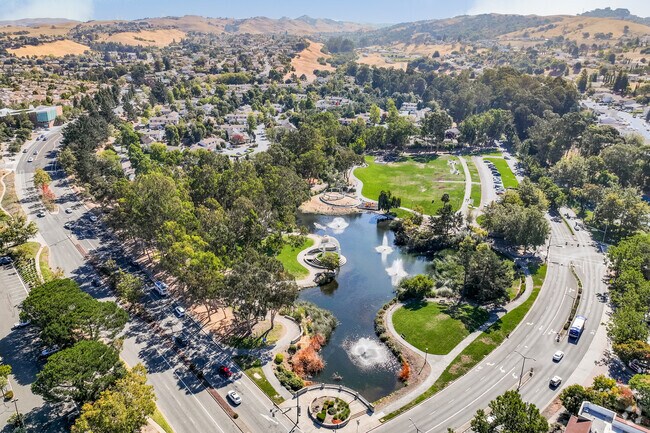
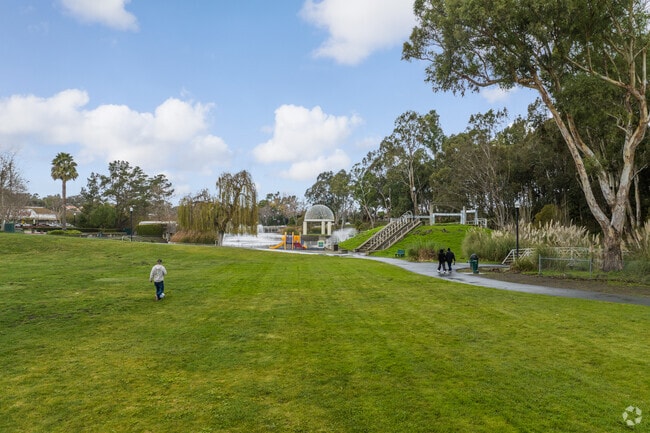
Refugio Park has a large field to play on in Hercules.
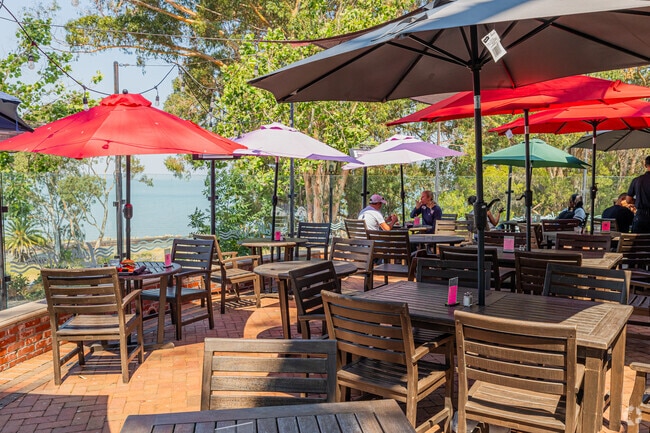
The Waterfront's Leila by the Bay has a wonderful outdoor seating area.
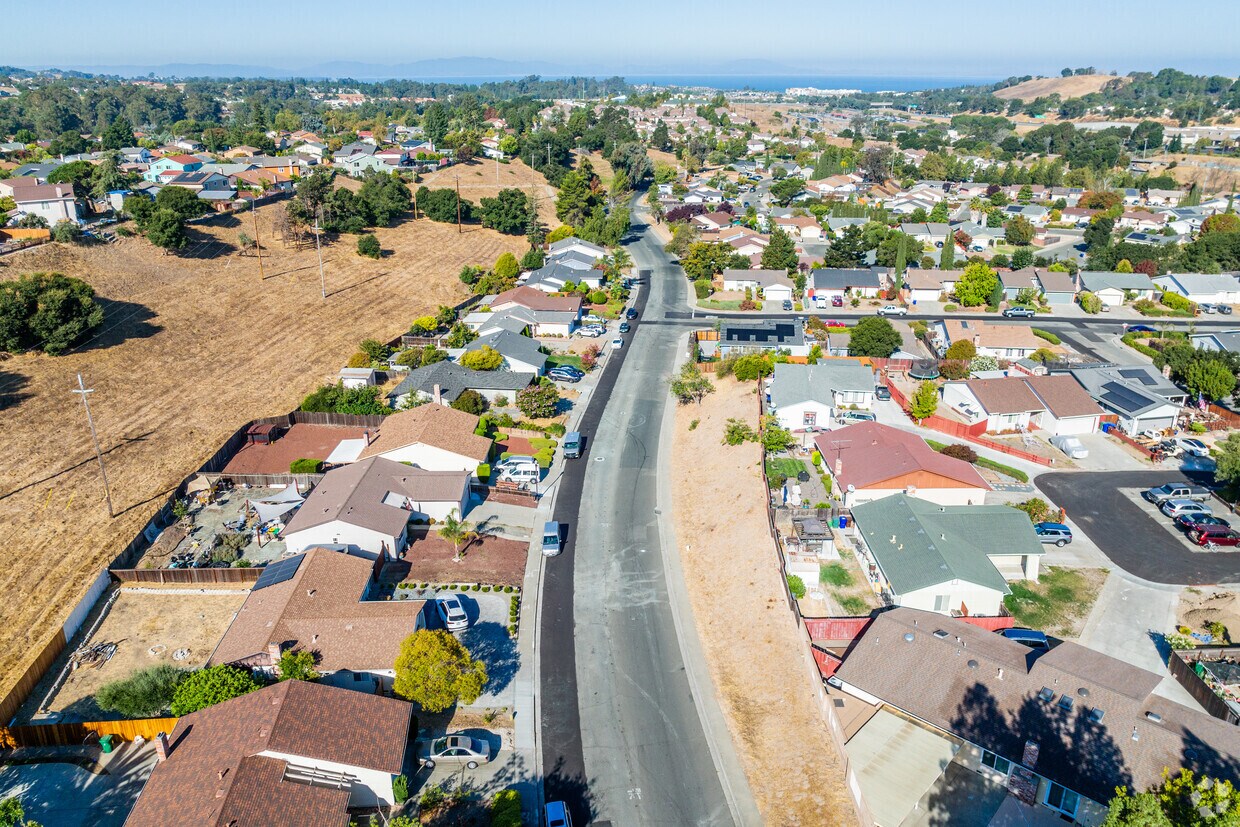
A Birdseye view of the suburbs in Hercules.
Highway 80 is conveniently located in Hercules and offers easy access to get to San Francisco.
West Cat Offers easily attainable public transportation in Hercules.
Median Household Income
$123,022
Average: $149,494
Education
9,351
Residents Have a Degree
Job Market
13,278
Workers Employed
Median Age
44 Years
Largest Age Group
35-44 Years
Approximately 14% of Residents
Under 20
20%
Over 65
22%
Housing Distribution
Hercules has more homeowners than renters.

Education Distribution
Review this city's overall education levels.

As of July 2026, the average apartment rent in Hercules, CA is $2,390 for a studio, $2,745 for one bedroom, $3,369 for two bedrooms, and $3,779 for three bedrooms. Apartment rent in Hercules has decreased by -1.7% in the past year.
Explore how walkable, bikeable, drivable, and transit-friendly Hercules, CA is for everyday living.
Somewhat Walkable
Walkability
Limited Public Transit
Transit
Exceptionally Drivable
Drivability
Fairly Bikeable
Bikeability
Public
Grades K-5
482 Students

Public
Grades K-5
482 Students

Public
Grades K-5
421 Students

Public
Grades K-5
421 Students
Lupine Hills Elementary School
Public
Grades K-5
387 Students
Public
Grades 6-8
596 Students

Public
Grades 6-8
596 Students

Public
Grades 9-12
767 Students
Public
Grades 9-12
767 Students
† Our analysis of utilities, groceries, transportation, healthcare, home prices, and other goods and services is sourced from the Cost of Living Index, a respected benchmark published by the Council for Community and Economic Research (C2ER) that provides a thorough overview of living expenses across different regions.
Rent data is provided by CoStar Group’s Market Trend reports. As the industry leader in commercial real estate information, analytics, and news, CoStar conducts extensive research to produce and maintain a comprehensive database of commercial real estate information. We combine this data with public record to provide the most up-to-date rental information available.
Consumer goods, services, and home prices are sourced from the Cost of Living Index published by the Council for Community and Economic Research (C2ER). The data on this page is updated quarterly. It was last published in June 2026.
Demographic information comes from Neustar and combines detailed address data with U.S. Census and American Community Survey statistics to produce reliable local estimates.


")


