Median Age
34 Years
Largest Age Group
10-19 Years
Approximately 16% of Residents
Under 20
31%
Over 65
10%

Avg Rent
$1,306
Population
34,066
Renter Mix
25% Rent
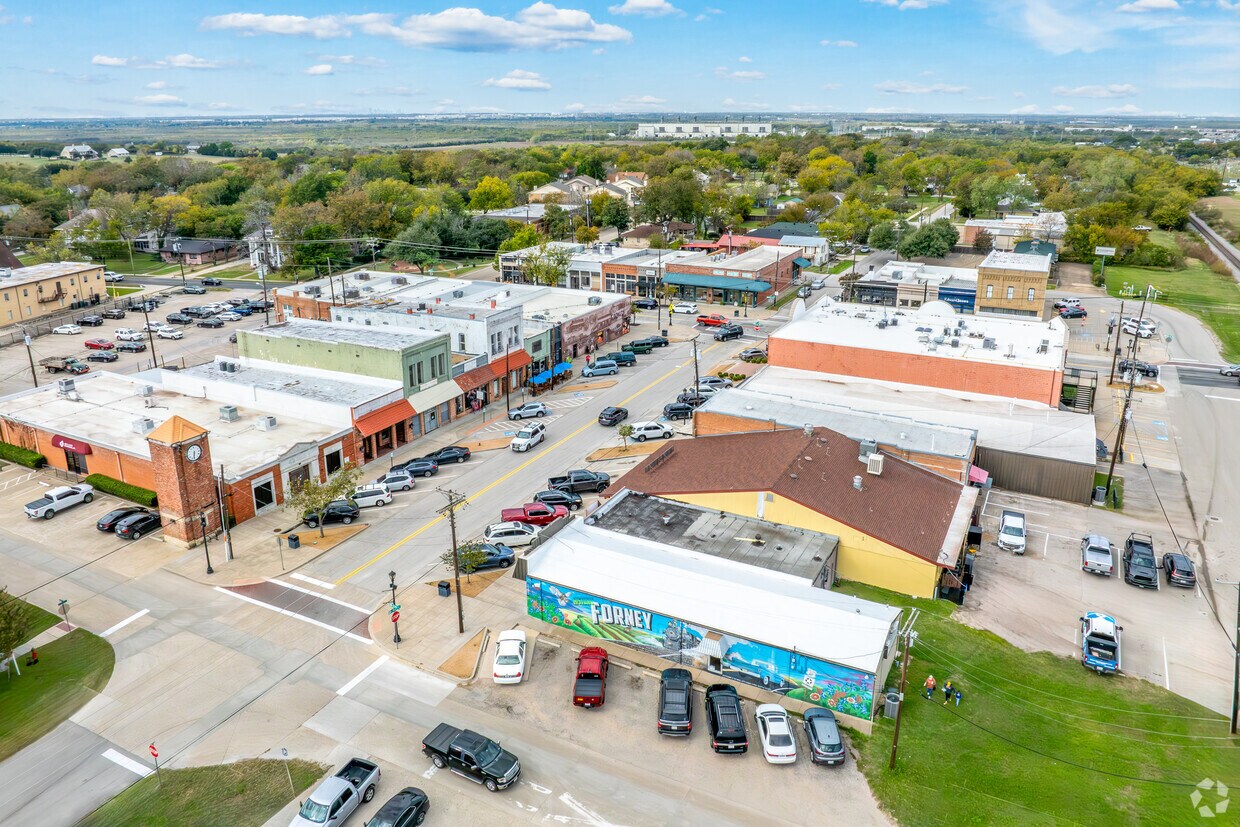
Forney wears a pretty distinctive badge: it’s the only city in Texas officially named the Antique Capital of the state by the Texas Legislature. Sitting about 30 minutes east of downtown Dallas along Highway 80, this Kaufman County city strikes a balance between small-town charm and big-city access. The historic downtown draws weekend explorers with its specialty shops and local eateries tucked into well-preserved older buildings, while parks and open green spaces give everyday life a relaxed, unhurried pace.
Renters in Forney will find a solid mix of options, from spacious townhomes and single-story rentals to newer apartment communities that have followed the city’s steady growth. The rental landscape tends to skew toward more room for the money compared to what you’d find closer to Dallas, making it an appealing alternative for those who want square footage without sacrificing proximity to the metro. With quick access to I-20 and Highway 80, commuting into the greater DFW area is straightforward, and everyday conveniences like grocery stores, dining, and retail are close at hand.
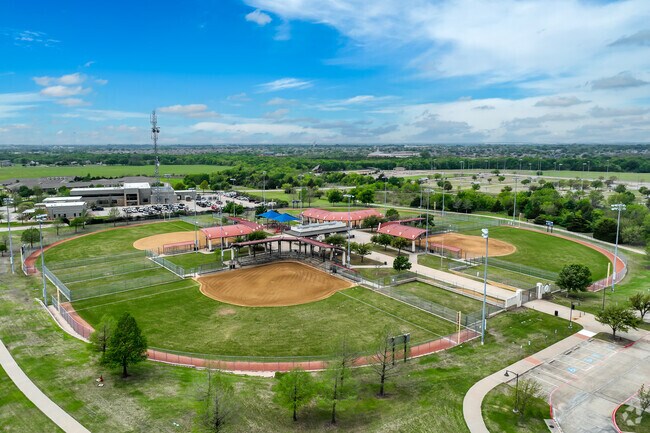
Forney Neighborhoods are a great location for people to own their own home.
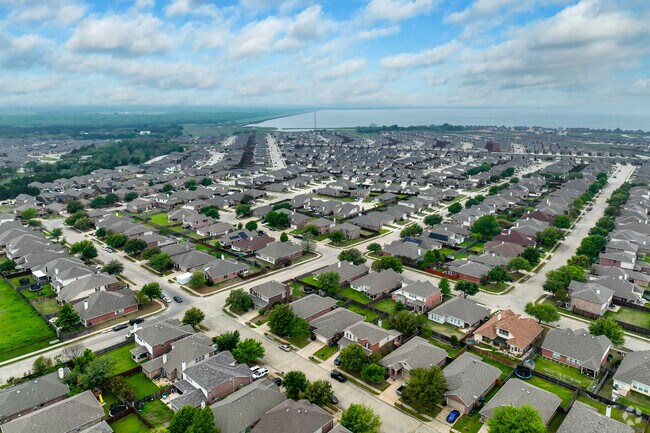
Forney Neighborhood located close to the lake.
Windmill Farms is about 30 miles east of Dallas in Forney, Texas.
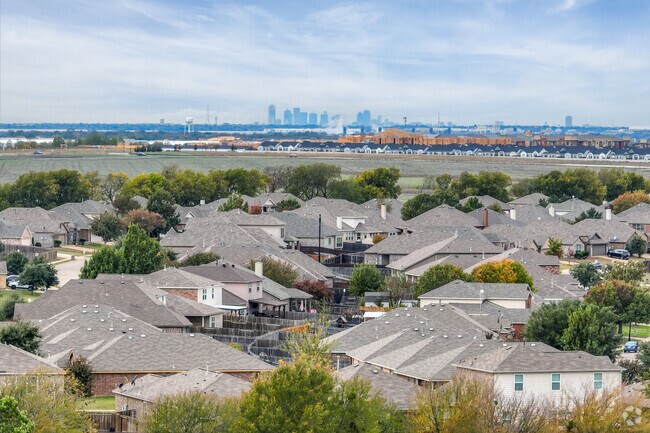
Highland Meadows residents enjoy living next to Lake Ray Hubbard.
Forney
Forney
Median Household Income
$91,340
Average: $106,325
Education
7,849
Residents Have a Degree
Job Market
18,086
Workers Employed
Median Age
34 Years
Largest Age Group
10-19 Years
Approximately 16% of Residents
Under 20
31%
Over 65
10%
Housing Distribution
Forney has more homeowners than renters.

Education Distribution
Review this city's overall education levels.

As of July 2026, the average apartment rent in Forney, TX is $1,051 for a studio, $1,303 for one bedroom, $1,725 for two bedrooms, and $2,054 for three bedrooms. Apartment rent in Forney has decreased by -3.8% in the past year.
Explore how walkable, bikeable, drivable, and transit-friendly Forney, TX is for everyday living.
Somewhat Walkable
Walkability
Exceptionally Drivable
Drivability
Fairly Bikeable
Bikeability
Public
Grades K-5
694 Students

Public
Grades K-5
662 Students
Public
Grades PK-5
786 Students

Public
Grades K-5
737 Students
Public
Grades PK-5
782 Students

Public
Grades 6-8
738 Students
Public
Grades 6-8
903 Students
Public
Grades 6-8
807 Students

Public
Grades 6-8
642 Students
Public
Grades 6-8
673 Students

Public
Grades 9-12
2,582 Students

Public
Grades 6-12
2,502 Students

† Our analysis of utilities, groceries, transportation, healthcare, home prices, and other goods and services is sourced from the Cost of Living Index, a respected benchmark published by the Council for Community and Economic Research (C2ER) that provides a thorough overview of living expenses across different regions.
Rent data is provided by CoStar Group’s Market Trend reports. As the industry leader in commercial real estate information, analytics, and news, CoStar conducts extensive research to produce and maintain a comprehensive database of commercial real estate information. We combine this data with public record to provide the most up-to-date rental information available.
Consumer goods, services, and home prices are sourced from the Cost of Living Index published by the Council for Community and Economic Research (C2ER). The data on this page is updated quarterly. It was last published in June 2026.
Demographic information comes from Neustar and combines detailed address data with U.S. Census and American Community Survey statistics to produce reliable local estimates.


