7 Best Places to Live in Rhode Island
Thinking about moving to Rhode Island but don’t know where to start? Explore our comprehensive guide to five of Rhode Island’s best cities.


Avg Rent
$1,770
Population
82,482
Renter Mix
34% Rent
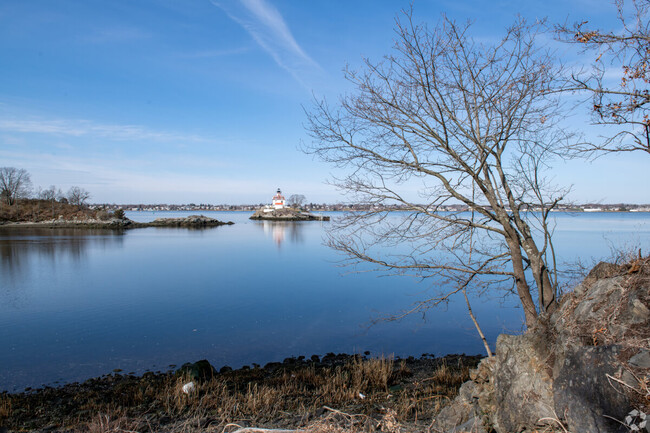
Situated about five miles south of Downtown Providence, Cranston is a picturesque suburb teeming with true New England charm. Cranston residents enjoy a peaceful atmosphere along with access to myriad suburban delights. National retailers and familiar restaurants abound at the outdoor Garden City Center while independent shops and local eateries are strewn throughout the city.
Numerous scenic parks, rivers, and ponds provide space for all kinds of outdoor activities in Cranston. The many metropolitan amenities of Providence are also within close reach, with Roger Williams Park Zoo, Providence Children’s Museum, Providence Place, and Brown University all just a short drive away. Convenience to I-95, I-295, and TF Green Airport makes commuting and traveling from Cranston a breeze.
Median Household Income
$82,102
Average: $103,793
Education
25,157
Residents Have a Degree
Job Market
42,646
Workers Employed
Median Age
42 Years
Largest Age Group
30-39 Years
Approximately 14% of Residents
Under 20
21%
Over 65
20%
Housing Distribution
Cranston has more homeowners than renters.

Education Distribution
Review this city's overall education levels.

As of July 2026, the average apartment rent in Cranston, RI is $1,455 for a studio, $1,770 for one bedroom, $2,221 for two bedrooms, and $2,548 for three bedrooms. Apartment rent in Cranston has increased by 0.6% in the past year.
7 Best Places to Live in Rhode Island
Thinking about moving to Rhode Island but don’t know where to start? Explore our comprehensive guide to five of Rhode Island’s best cities.

Renting a House? Don’t Sign Until You’ve Asked These 20 Key Questions
Before renting a house, ask these 20 important questions.

Missing These Household Appliances? No Problem!
No dishwasher, washer, or oven? Here’s how renters make missing appliances work without overspending.
Explore how walkable, bikeable, drivable, and transit-friendly Cranston, RI is for everyday living.
Fairly Walkable
Walkability
Limited Public Transit
Transit
Very Drivable
Drivability
Somewhat Bikeable
Bikeability
Public
Grades K-5
565 Students

Public
Grades K-5
470 Students
Public
Grades K-5
274 Students
Orchard Farms Elementary School
Public
Grades PK-5
461 Students

Hope Highlands Elementary School
Public
Grades K-6
363 Students
Public
Grades 6-8
747 Students
Public
Grades 6-8
371 Students
Public
Grades 6-8
747 Students

Public
Grades 6-8
582 Students

Public
Grades 9-12
1,712 Students

Public
Grades 9-12
1,622 Students

Apprenticeship Exploration School
Public
Grades 9-12
192 Students

† Our analysis of utilities, groceries, transportation, healthcare, home prices, and other goods and services is sourced from the Cost of Living Index, a respected benchmark published by the Council for Community and Economic Research (C2ER) that provides a thorough overview of living expenses across different regions.
Rent data is provided by CoStar Group’s Market Trend reports. As the industry leader in commercial real estate information, analytics, and news, CoStar conducts extensive research to produce and maintain a comprehensive database of commercial real estate information. We combine this data with public record to provide the most up-to-date rental information available.
Consumer goods, services, and home prices are sourced from the Cost of Living Index published by the Council for Community and Economic Research (C2ER). The data on this page is updated quarterly. It was last published in June 2026.
Demographic information comes from Neustar and combines detailed address data with U.S. Census and American Community Survey statistics to produce reliable local estimates.


