Median Age
45 Years
Largest Age Group
60-69 Years
Approximately 14% of Residents
Under 20
20%
Over 65
23%

Avg Rent
$2,088
Population
31,053
Renter Mix
31% Rent
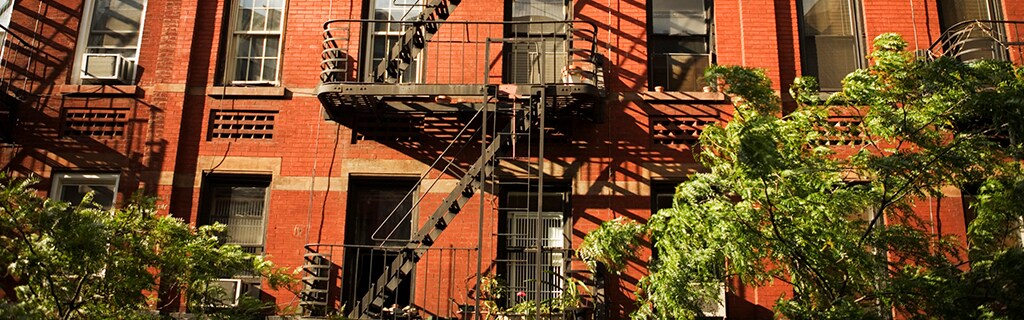
Johnston, Rhode Island is a quiet town in Providence County that rewards those who want a grounded, no-fuss place to call home without straying far from the energy of a major city. Sharing a border with Providence and Cranston, Johnston occupies about 25 square miles and holds a close-knit identity shaped by decades of working-class pride and deep Italian-American heritage. The town was incorporated in 1759 and named for colonial attorney general Augustus Johnston, and its history shows in landmarks like the Clemence Irons House, a 1691 stone-ender structure listed on the National Register of Historic Places. Neighborhoods such as Thornton, Simmonsville, Hughesdale, and Manton each carry their own character, ranging from tree-lined residential streets to areas with easy access to Atwood Avenue's mix of local shops and everyday conveniences.
The housing stock here leans heavily toward single-family homes and smaller apartment communities, offering renters more space than they might find in neighboring Providence. Options range from garden-style rentals to converted multi-family buildings that reflect the town's traditional New England architecture. Johnston sits just off I-95, making commutes into Providence straightforward, and the Rhode Island Public Transit Authority connects residents to the broader region by bus.
Median Household Income
$78,385
Average: $94,576
Education
7,288
Residents Have a Degree
Job Market
15,403
Workers Employed
Median Age
45 Years
Largest Age Group
60-69 Years
Approximately 14% of Residents
Under 20
20%
Over 65
23%
Housing Distribution
Johnston has more homeowners than renters.

Education Distribution
Review this city's overall education levels.

As of July 2026, the average apartment rent in Johnston, RI is $1,805 for a studio, $2,088 for one bedroom, $2,499 for two bedrooms, and $2,855 for three bedrooms. Apartment rent in Johnston has increased by 6.8% in the past year.
Explore how walkable, bikeable, drivable, and transit-friendly Johnston, RI is for everyday living.
Somewhat Walkable
Walkability
Minimal Public Transit
Transit
Exceptionally Drivable
Drivability
Somewhat Bikeable
Bikeability
Public
Grades K-5
260 Students

Public
Grades K-5
287 Students

Public
Grades K-5
402 Students

Public
Grades K-5
362 Students
Public
Grades K-5
209 Students

Nicholas A. Ferri Middle School
Public
Grades 6-8
765 Students
Public
Grades 6-8
765 Students
Public
Grades 9-12
879 Students
Public
Grades 9-12
879 Students
† Our analysis of utilities, groceries, transportation, healthcare, home prices, and other goods and services is sourced from the Cost of Living Index, a respected benchmark published by the Council for Community and Economic Research (C2ER) that provides a thorough overview of living expenses across different regions.
Rent data is provided by CoStar Group’s Market Trend reports. As the industry leader in commercial real estate information, analytics, and news, CoStar conducts extensive research to produce and maintain a comprehensive database of commercial real estate information. We combine this data with public record to provide the most up-to-date rental information available.
Consumer goods, services, and home prices are sourced from the Cost of Living Index published by the Council for Community and Economic Research (C2ER). The data on this page is updated quarterly. It was last published in June 2026.
Demographic information comes from Neustar and combines detailed address data with U.S. Census and American Community Survey statistics to produce reliable local estimates.


