Median Age
33 Years
Largest Age Group
20-29 Years
Approximately 23% of Residents
Under 20
22%
Over 65
17%

Avg Rent
$3,288
Population
22,926
Renter Mix
35% Rent
One of the rare communities in Massachusetts that straddles three municipalities -- Brookline, Boston, and Newton -- Chestnut Hill is defined by its ZIP code rather than formal city lines. Daily life here revolves around tree-lined streets, the scenic 135-acre Chestnut Hill Reservoir, and easy access to upscale shopping along Boylston Street. Dining and retail are within minutes for most residents, and walkability improves considerably near the commercial centers.
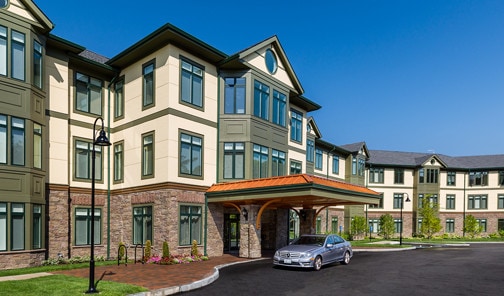
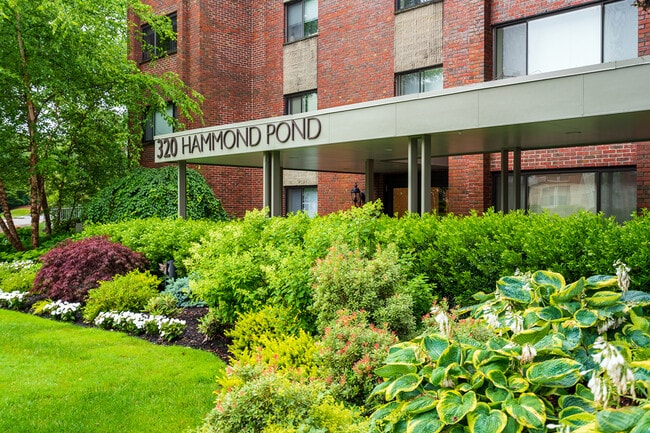
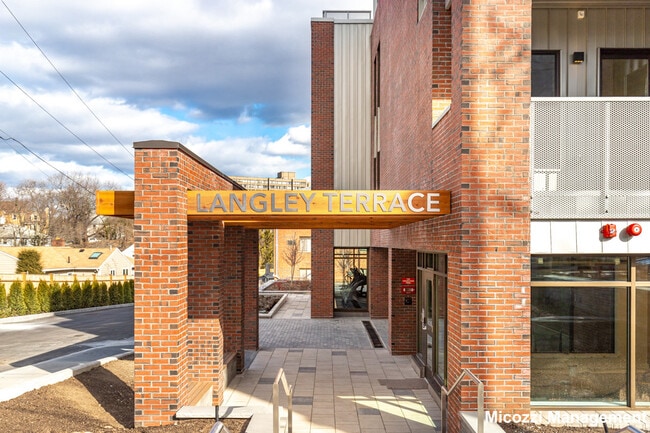
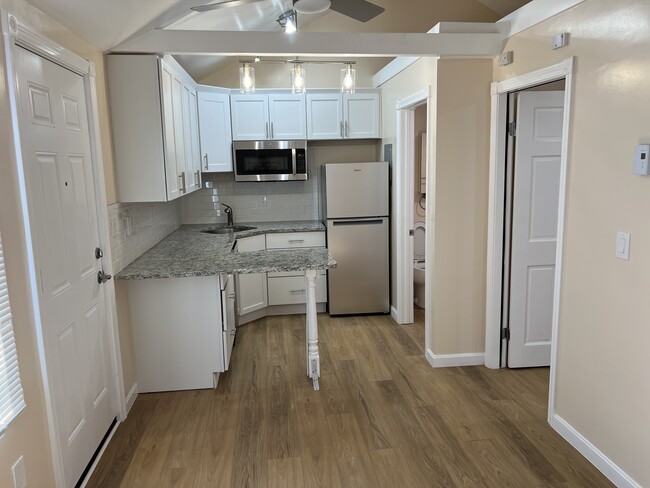
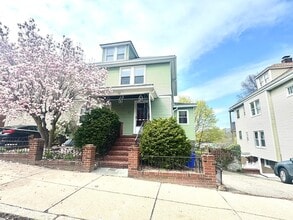
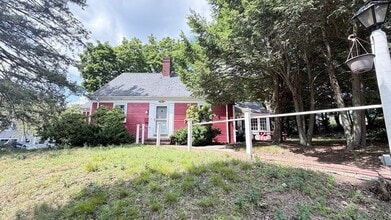
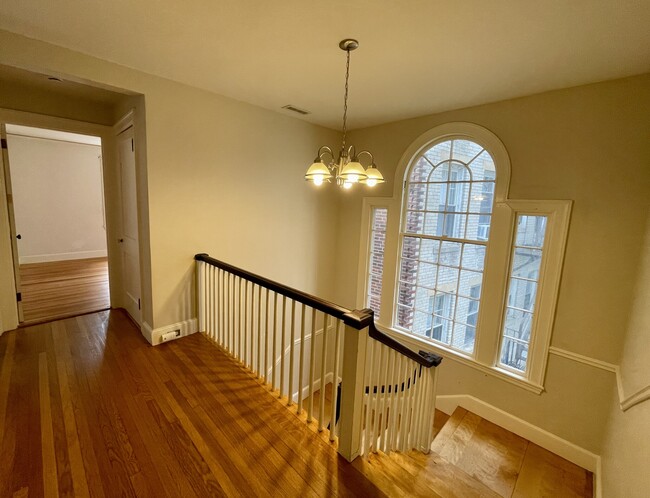
The rental landscape includes a mix of classic New England architecture, spacious townhomes, and well-appointed mid-rise apartment communities. Stately brick buildings share the streetscape with updated units that suit a range of tastes, and the overall housing stock reflects the area's established residential character.
Boston College anchors the northeastern edge of the village and brings an active, collegiate energy to the surrounding streets. The area also holds a notable place in the running world: the Boston Marathon route passes through Chestnut Hill each April, drawing spectators from across the region to cheer on runners along the course.
Median Household Income
$162,269
Average: $181,293
Education
13,307
Residents Have a Degree
Job Market
11,144
Workers Employed
Median Age
33 Years
Largest Age Group
20-29 Years
Approximately 23% of Residents
Under 20
22%
Over 65
17%
Housing Distribution
Chestnut Hill has more homeowners than renters.

Education Distribution
Review this city's overall education levels.

As of September 2026, the average apartment rent in Chestnut Hill, MA is $2,180 for a studio, $3,284 for one bedroom, $5,131 for two bedrooms, and $6,390 for three bedrooms. Apartment rent in Chestnut Hill has increased by 1.4% in the past year.
Explore how walkable, bikeable, drivable, and transit-friendly Chestnut Hill, MA is for everyday living.
Moderately Walkable
Walkability
Limited Public Transit
Transit
Moderately Drivable
Drivability
Moderately Bikeable
Bikeability

† Our analysis of utilities, groceries, transportation, healthcare, home prices, and other goods and services is sourced from the Cost of Living Index, a respected benchmark published by the Council for Community and Economic Research (C2ER) that provides a thorough overview of living expenses across different regions.
Rent data is provided by CoStar Group’s Market Trend reports. As the industry leader in commercial real estate information, analytics, and news, CoStar conducts extensive research to produce and maintain a comprehensive database of commercial real estate information. We combine this data with public record to provide the most up-to-date rental information available.
Consumer goods, services, and home prices are sourced from the Cost of Living Index published by the Council for Community and Economic Research (C2ER). The data on this page is updated quarterly. It was last published in September 2026.
Demographic information comes from Neustar and combines detailed address data with U.S. Census and American Community Survey statistics to produce reliable local estimates.