Median Age
40 Years
Largest Age Group
20-29 Years
Approximately 15% of Residents
Under 20
22%
Over 65
22%
Avg Rent
$1,311
Population
151,549
Renter Mix
32% Rent
The town of Amherst is located in Erie County, just 12 miles from downtown Buffalo. This suburban community is the most populous area in Upstate New York; due to its size, residents are served by three different school districts. Five college and universities reside in Amherst, including Daeman College and University at Buffalo.
From student apartments to affordable rentals, you’ll find it all in Amherst. Residents appreciate their proximity to Buffalo Niagara International Airport, Boulevard Mall, Trader Joe’s, and so much more. Audubon Park’s walking trails, golf course, and wildlife observation are popular activities among residents and students. Town events and festivals are hosted at the Buffalo Niagara Heritage Village - an outdoor living history museum - including the Quilt Show and Harvest Festival.
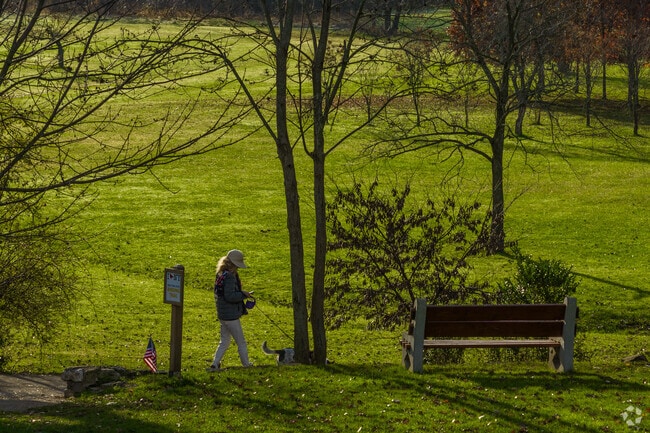
A woman walks her dog at a large park in Amherst, New York.
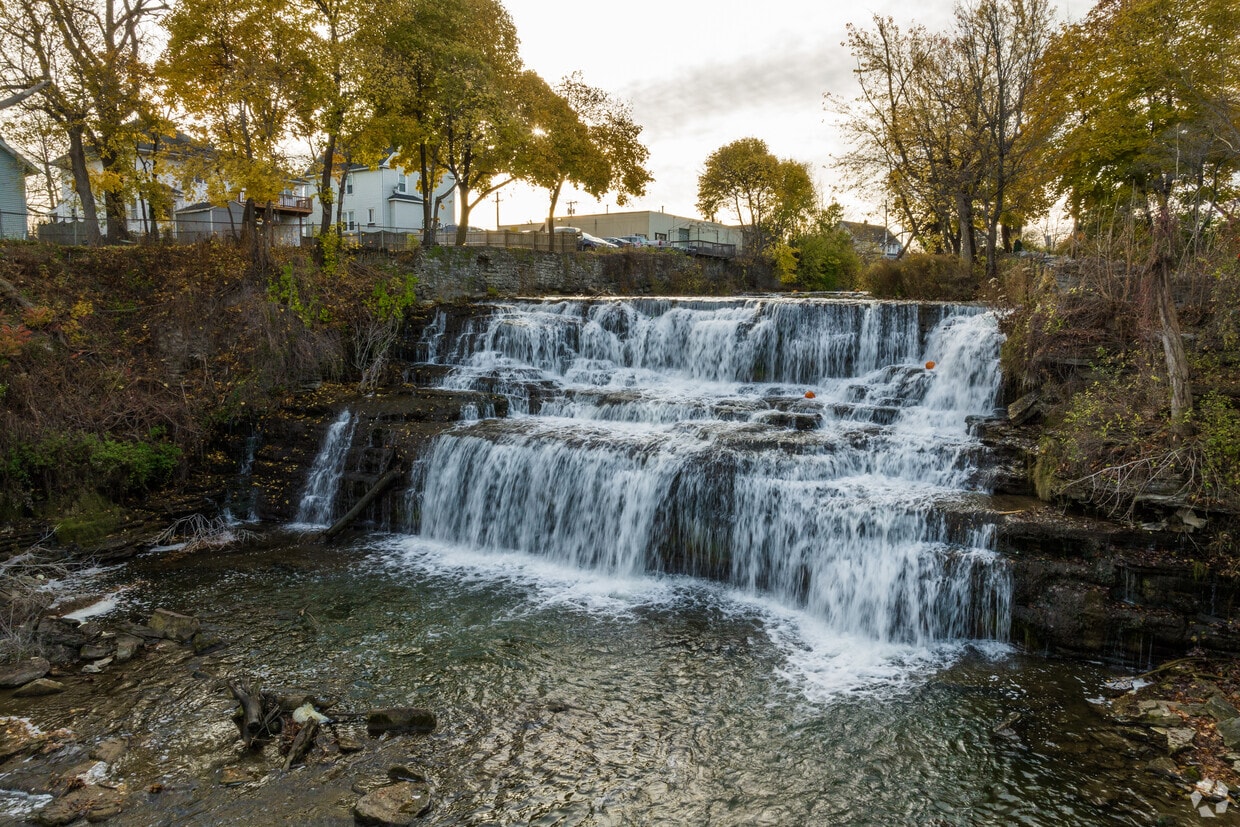
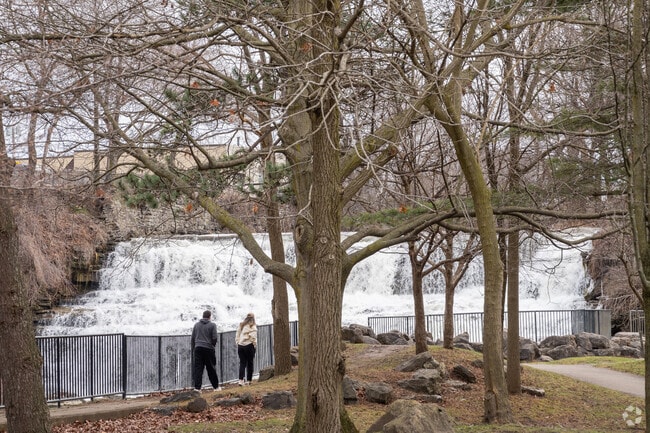
Glen Falls in Amherst are a stunning sight.
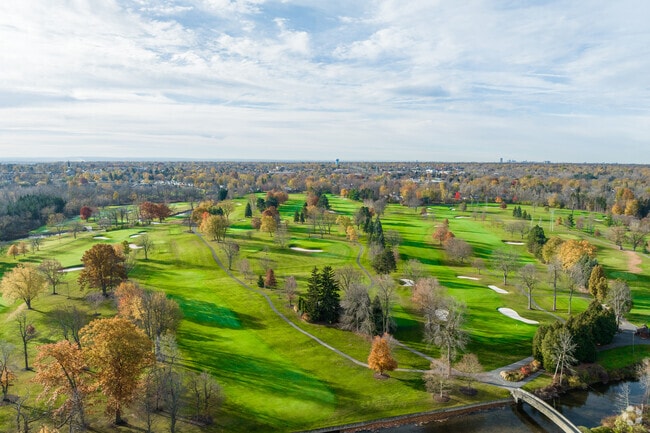
Visit Amherst in New York and go golfing on the greens.
The Market at Bassett Park in Amherst was started in 2020.
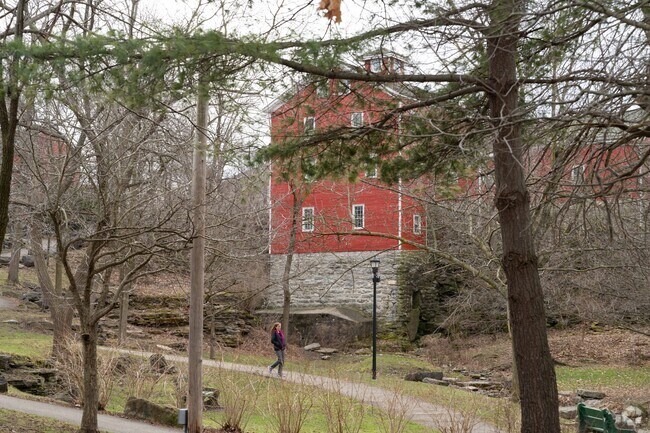
Amherst State Park has a creek to explore for walks.
Amherst has one of the largest populations in New York at over 100,000 people.
Median Household Income
$85,878
Average: $110,283
Education
66,921
Residents Have a Degree
Job Market
75,241
Workers Employed
Median Age
40 Years
Largest Age Group
20-29 Years
Approximately 15% of Residents
Under 20
22%
Over 65
22%
Housing Distribution
Amherst has more homeowners than renters.

Education Distribution
Review this city's overall education levels.

As of July 2026, the average apartment rent in Amherst, NY is $1,174 for a studio, $1,308 for one bedroom, $1,536 for two bedrooms, and $2,085 for three bedrooms. Apartment rent in Amherst has decreased by -1.0% in the past year.
Explore how walkable, bikeable, drivable, and transit-friendly Amherst, NY is for everyday living.
Somewhat Walkable
Walkability
Minimal Public Transit
Transit
Very Drivable
Drivability
Moderately Bikeable
Bikeability
Public
Grades PK-5
738 Students

Public
Grades PK-5
708 Students

Public
Grades K-5
488 Students

Heritage Heights Elementary School
Public
Grades PK-5
456 Students
Willow Ridge Elementary School
Public
Grades PK-5
428 Students
Public
Grades 6-8
646 Students
Public
Grades 6-8
858 Students

Public
Grades 9-12
865 Students

Public
Grades 9-12
1,104 Students
† Our analysis of utilities, groceries, transportation, healthcare, home prices, and other goods and services is sourced from the Cost of Living Index, a respected benchmark published by the Council for Community and Economic Research (C2ER) that provides a thorough overview of living expenses across different regions.
Rent data is provided by CoStar Group’s Market Trend reports. As the industry leader in commercial real estate information, analytics, and news, CoStar conducts extensive research to produce and maintain a comprehensive database of commercial real estate information. We combine this data with public record to provide the most up-to-date rental information available.
Consumer goods, services, and home prices are sourced from the Cost of Living Index published by the Council for Community and Economic Research (C2ER). The data on this page is updated quarterly. It was last published in June 2026.
Demographic information comes from Neustar and combines detailed address data with U.S. Census and American Community Survey statistics to produce reliable local estimates.


