Median Age
43 Years
Largest Age Group
55-64 Years
Approximately 15% of Residents
Under 20
22%
Over 65
20%

Avg Rent
$2,664
Population
22,751
Renter Mix
13% Rent
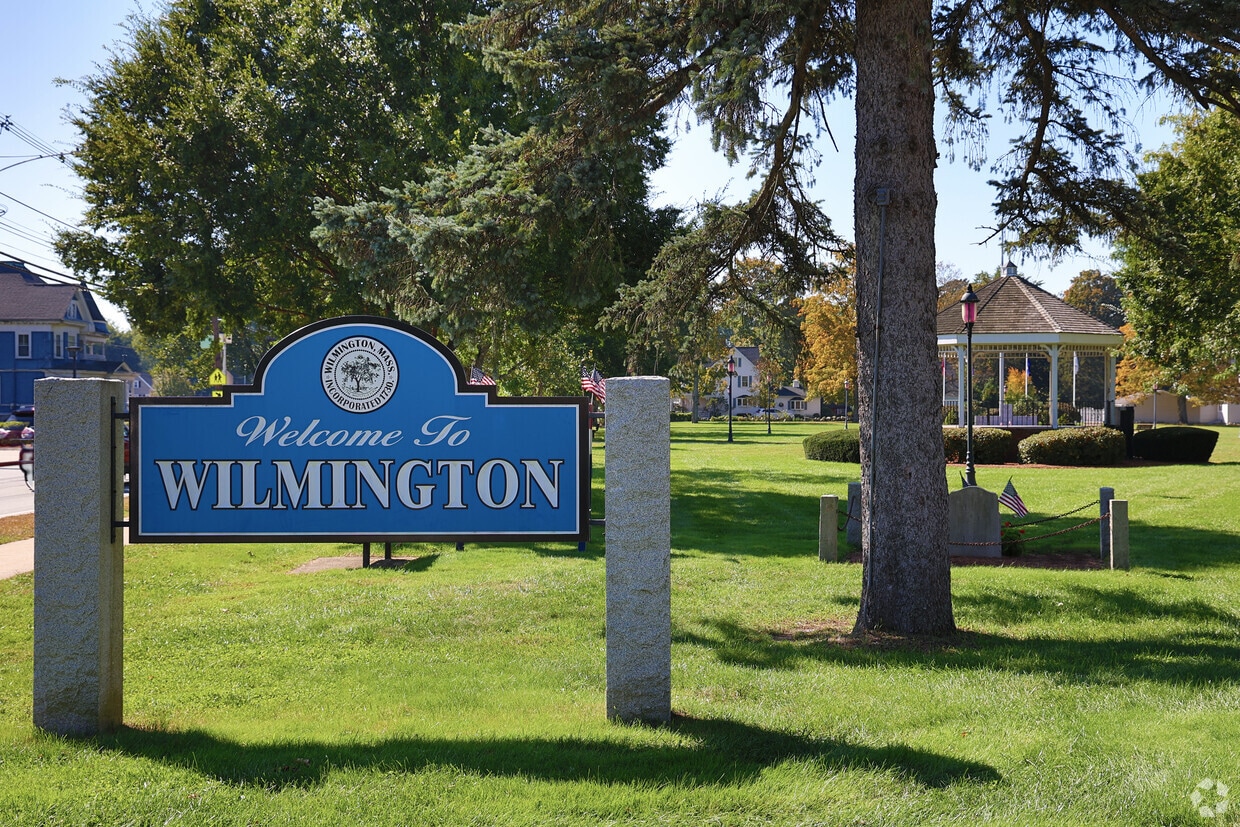
Wilmington sits 15 miles northwest of Boston, close enough for city access yet far enough for tree-lined streets and quiet neighborhoods. Silver Lake and the Cranberry Bog give the town natural character that distinguishes it from surrounding communities. Commuters can take I-93 or the MBTA Lowell Line, reaching downtown Boston in about 20 minutes.
The town center offers a relaxed, walkable environment with local shops and restaurants scattered throughout. History shapes the landscape — the Col. Joshua Harnden Tavern, built in 1770 and listed on the National Register of Historic Places, now serves as the Town Museum. The Middlesex Canal, one of America's earliest engineering achievements, once ran through town with traces still visible.
The rental market includes apartment communities, townhomes, and smaller multi-family buildings. Options range from one-bedroom units to spacious layouts that incorporate the area's wooded surroundings.
The beauty of Mill Brook Wetlands in South Wilmington is evident in the Fall.
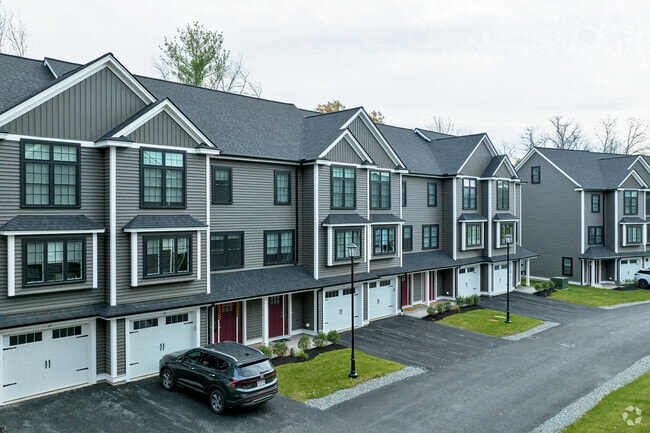
Wilmington has newly built townhomes.
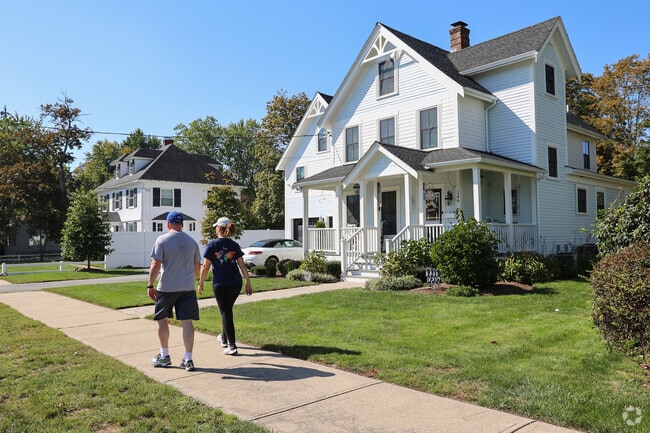
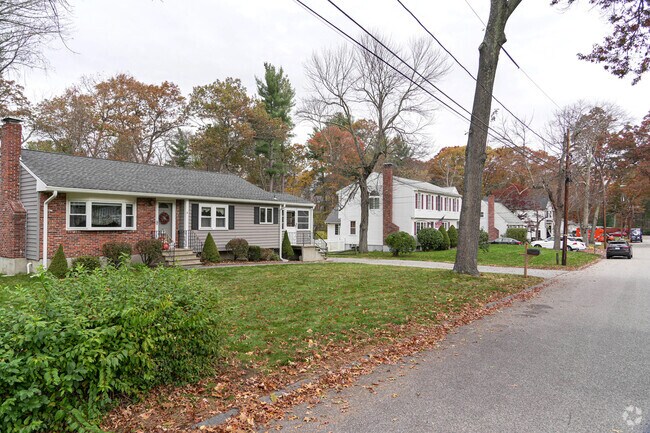
Ranch and split level style homes are common in Wilmington.
The Ristuccia Memorial Arena is a local favorite for hockey and ice skating in South Wilmington.
Residents will find a nearby MBTA Commuter Rail stop in the Wilmington center.
South Wilmington golfers enjoy a game at the nearby Meadow Brook Golf Club.
Median Household Income
$151,029
Average: $171,045
Education
8,861
Residents Have a Degree
Job Market
13,212
Workers Employed
Median Age
43 Years
Largest Age Group
55-64 Years
Approximately 15% of Residents
Under 20
22%
Over 65
20%
Housing Distribution
Wilmington has more homeowners than renters.

Education Distribution
Review this city's overall education levels.

As of July 2026, the average apartment rent in Wilmington, MA is $2,664 for one bedroom, $3,154 for two bedrooms, and $3,968 for three bedrooms. Apartment rent in Wilmington has increased by 3.6% in the past year.
Explore how walkable, bikeable, drivable, and transit-friendly Wilmington, MA is for everyday living.
Somewhat Walkable
Walkability
Minimal Public Transit
Transit
Exceptionally Drivable
Drivability
Somewhat Bikeable
Bikeability
Woburn Street Elementary School
Public
Grades K-5
370 Students

Public
Grades PK-5
300 Students
Public
Grades K-5
236 Students
Public
Grades K-5
293 Students

Public
Grades PK-5
293 Students
Public
Grades 6-8
807 Students
Public
Grades 9-12
633 Students
Public
Grades 9-12
633 Students
† Our analysis of utilities, groceries, transportation, healthcare, home prices, and other goods and services is sourced from the Cost of Living Index, a respected benchmark published by the Council for Community and Economic Research (C2ER) that provides a thorough overview of living expenses across different regions.
Rent data is provided by CoStar Group’s Market Trend reports. As the industry leader in commercial real estate information, analytics, and news, CoStar conducts extensive research to produce and maintain a comprehensive database of commercial real estate information. We combine this data with public record to provide the most up-to-date rental information available.
Consumer goods, services, and home prices are sourced from the Cost of Living Index published by the Council for Community and Economic Research (C2ER). The data on this page is updated quarterly. It was last published in June 2026.
Demographic information comes from Neustar and combines detailed address data with U.S. Census and American Community Survey statistics to produce reliable local estimates.


