Median Age
43 Years
Largest Age Group
35-44 Years
Approximately 14% of Residents
Under 20
22%
Over 65
21%

Avg Rent
$2,780
Population
26,249
Renter Mix
32% Rent
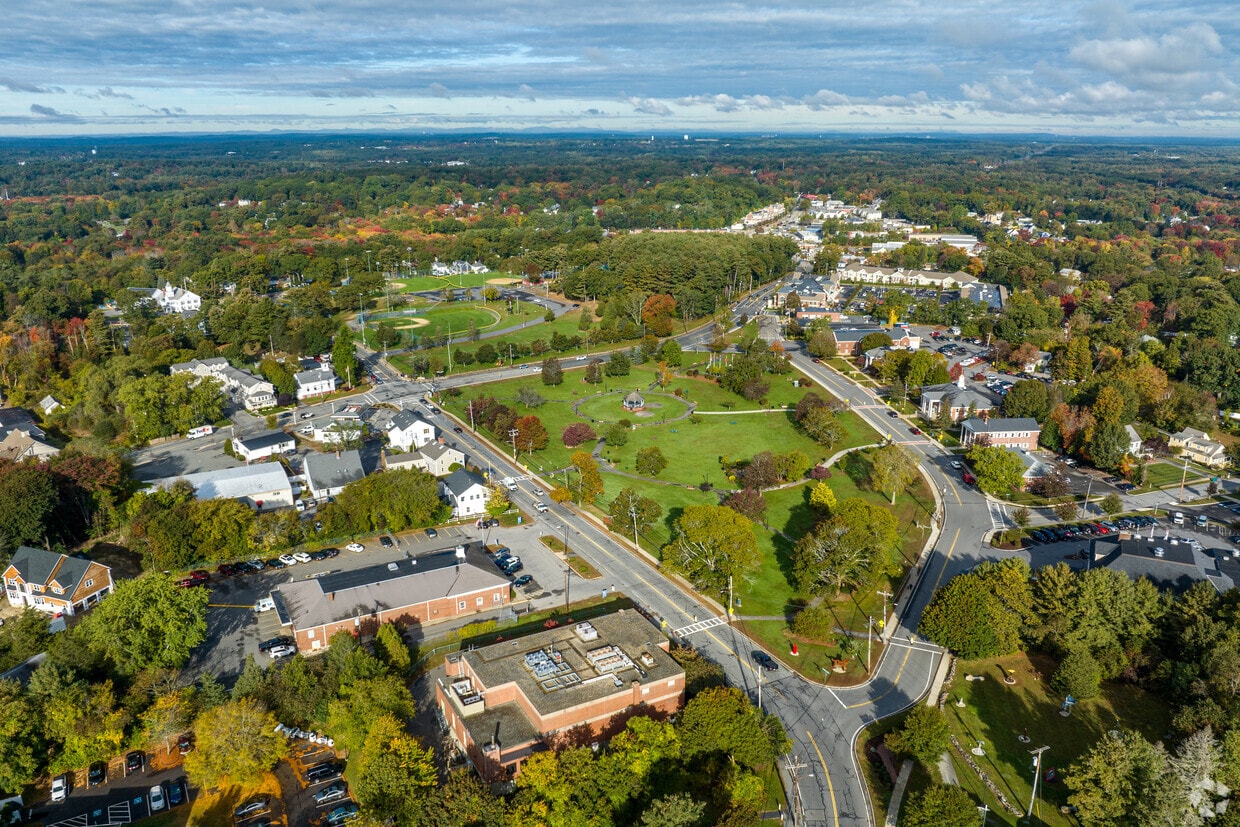
In the northwest corner of Boston, Massachusetts, you’ll find the quaint suburb of Burlington.
A part of metropolitan Greater Boston, Burlington is easily accessible to I-95. This picturesque and charming community is the perfect commuter town, allowing you easy access to Boston while offering a quaint and cozy neighborhood to come home to as well. The historical ambiance of this town is sure to enhance the comfortable, family-friend atmosphere, and the colonial architecture throughout brings a charming character to this idyllic Massachusetts town.
Enjoy the walking trails and serene fishing spots around town, or go bowling at Kings Burlington. And, don’t forget that with the city of Boston just a stone’s throw away, culture and nightlife are always wherever you are when you rent your next apartment in Burlington, Massachusetts.
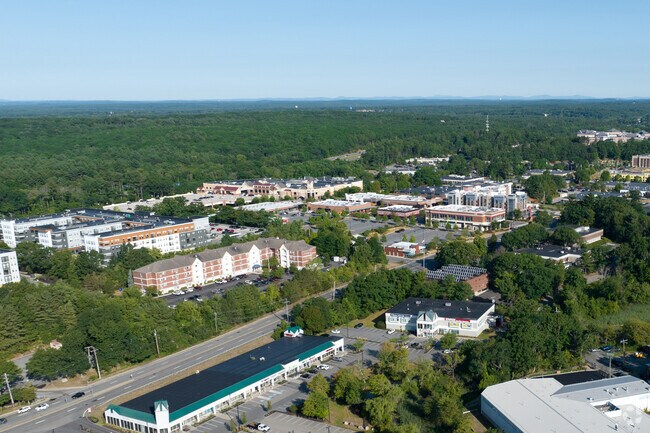
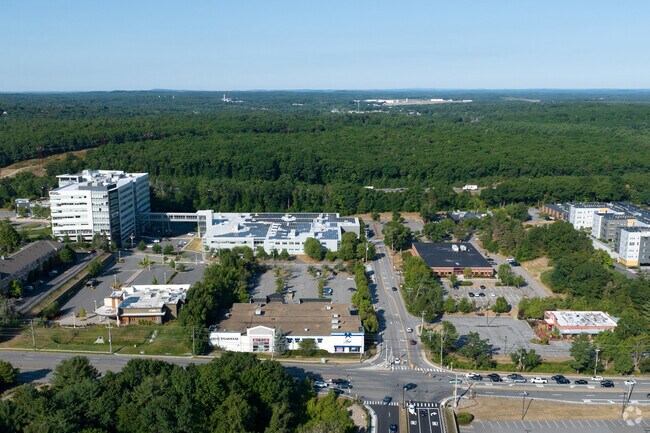
Burlington residents work and shop around 3rd Avenue, a major vein in the neighborhood.
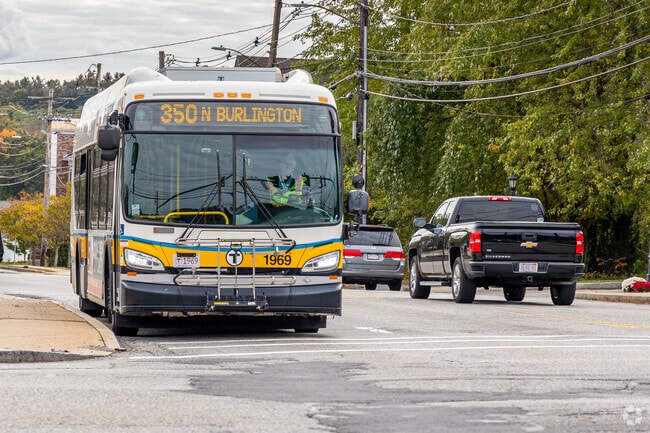
Burlington's public transportation is served by the MBTA with buses and nearby commuter rail.
The Statue Garden near the town's center is a great place to stop and visit in Burlington, MA.
The Burlington Community Garden serves a number of residents and has open spaces in Burlington.
The expansive Burlington Mall shopping center has huge variety of shops in Burlington.
The Burlington Common Park is a great area to walk your dog and meet other neighbors.
Median Household Income
$131,437
Average: $159,535
Education
12,310
Residents Have a Degree
Job Market
14,200
Workers Employed
Median Age
43 Years
Largest Age Group
35-44 Years
Approximately 14% of Residents
Under 20
22%
Over 65
21%
Housing Distribution
Burlington has more homeowners than renters.

Education Distribution
Review this city's overall education levels.

As of July 2026, the average apartment rent in Burlington, MA is $2,121 for a studio, $2,767 for one bedroom, $3,175 for two bedrooms, and $3,772 for three bedrooms. Apartment rent in Burlington has increased by 7.0% in the past year.
Explore how walkable, bikeable, drivable, and transit-friendly Burlington, MA is for everyday living.
Fairly Walkable
Walkability
Limited Public Transit
Transit
Exceptionally Drivable
Drivability
Fairly Bikeable
Bikeability
Public
Grades K-5
420 Students

Public
Grades K-5
503 Students

Francis Wyman Elementary School
Public
Grades K-5
503 Students
Public
Grades K-5
369 Students
Public
Grades K-5
339 Students
Public
Grades 6-8
826 Students

Marshall Simonds Middle School
Public
Grades 6-8
826 Students
Public
Grades PK & 9-12
1,000 Students
Public
Grades PK & 9-12
1,000 Students
† Our analysis of utilities, groceries, transportation, healthcare, home prices, and other goods and services is sourced from the Cost of Living Index, a respected benchmark published by the Council for Community and Economic Research (C2ER) that provides a thorough overview of living expenses across different regions.
Rent data is provided by CoStar Group’s Market Trend reports. As the industry leader in commercial real estate information, analytics, and news, CoStar conducts extensive research to produce and maintain a comprehensive database of commercial real estate information. We combine this data with public record to provide the most up-to-date rental information available.
Consumer goods, services, and home prices are sourced from the Cost of Living Index published by the Council for Community and Economic Research (C2ER). The data on this page is updated quarterly. It was last published in June 2026.
Demographic information comes from Neustar and combines detailed address data with U.S. Census and American Community Survey statistics to produce reliable local estimates.


