Median Age
42 Years
Largest Age Group
10-19 Years
Approximately 14% of Residents
Under 20
26%
Over 65
20%


Avg Rent
$1,601
Population
35,809
Renter Mix
20% Rent
Tucked between the Scioto River and Ohio State University’s sprawling campus, Upper Arlington earns its local nickname “U.A.” with a personality all its own. The city maintains a relaxed, residential rhythm while staying minutes from Columbus’s energy, making it easy to catch a Buckeyes game or explore downtown without sacrificing tranquility. Old Arlington, listed on the National Register of Historic Places, gives the area genuine character and history.
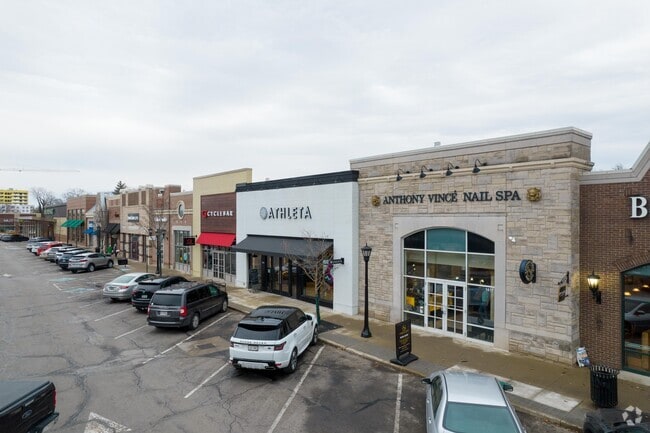
Green space weaves throughout the city, with golf courses and parks offering plenty of room to unwind. Tremont Road and Lane Avenue serve as go-to corridors for dining and shopping, featuring local spots that have become community staples. While walkability varies by block, most errands are easily handled by car with everything close at hand.
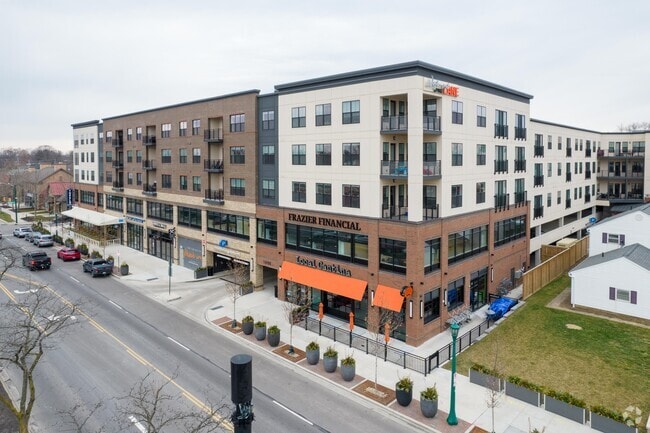
Renters find a mix of garden-style apartments, townhomes, and spacious multi-bedroom units. Options feel more boutique than high-rise, with well-maintained grounds reflecting the pride residents take in their community.
Upper Arlington's shopping districts contribute to the area's vibrant and diverse community.
The residential options in Upper Arlington contribute to the overall aesthetic appeal.
Thompson Park features a walking trail.
Invest in the enduring allure and practicality found in Upper Arlington's housing options.
The Scioto Country Club and its golf course are located off Riverside Road.
The community spirit in Upper Arlington is evident in local events and neighborhood initiatives.
Median Household Income
$138,412
Average: $166,326
Education
21,150
Residents Have a Degree
Job Market
19,395
Workers Employed
Median Age
42 Years
Largest Age Group
10-19 Years
Approximately 14% of Residents
Under 20
26%
Over 65
20%
Housing Distribution
Upper Arlington has more homeowners than renters.

Education Distribution
Review this city's overall education levels.

As of July 2026, the average apartment rent in Upper Arlington, OH is $1,567 for one bedroom, $1,903 for two bedrooms, and $2,592 for three bedrooms. Apartment rent in Upper Arlington has increased by 5.8% in the past year.
Explore how walkable, bikeable, drivable, and transit-friendly Upper Arlington, OH is for everyday living.
Fairly Walkable
Walkability
Limited Public Transit
Transit
Moderately Drivable
Drivability
Fairly Bikeable
Bikeability
Public
Grades K-5
692 Students

Public
Grades K-5
557 Students
Barrington Road Elementary School
Public
Grades K-5
802 Students

Public
Grades K-5
482 Students
Public
Grades 6-8
753 Students
Public
Grades 6-8
728 Students
Public
Grades 9-12
1,874 Students
† Our analysis of utilities, groceries, transportation, healthcare, home prices, and other goods and services is sourced from the Cost of Living Index, a respected benchmark published by the Council for Community and Economic Research (C2ER) that provides a thorough overview of living expenses across different regions.
Rent data is provided by CoStar Group’s Market Trend reports. As the industry leader in commercial real estate information, analytics, and news, CoStar conducts extensive research to produce and maintain a comprehensive database of commercial real estate information. We combine this data with public record to provide the most up-to-date rental information available.
Consumer goods, services, and home prices are sourced from the Cost of Living Index published by the Council for Community and Economic Research (C2ER). The data on this page is updated quarterly. It was last published in June 2026.
Demographic information comes from Neustar and combines detailed address data with U.S. Census and American Community Survey statistics to produce reliable local estimates.


