Median Age
38 Years
Largest Age Group
35-44 Years
Approximately 15% of Residents
Under 20
26%
Over 65
15%


Avg Rent
$1,328
Population
35,651
Renter Mix
38% Rent
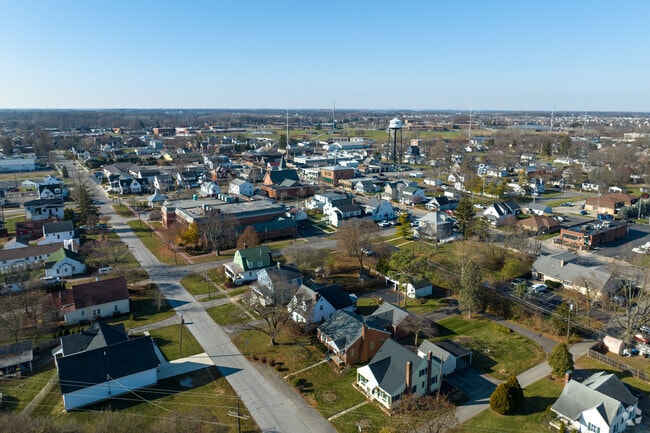
Hilliard started as a railroad stop in 1852, and that small-town energy still runs through the city's tree-lined streets and walkable Old Hilliard district today. Sitting just west of Columbus, it offers quick access to I-270 and I-70, so Downtown Columbus, Dublin's corporate campuses, and The Ohio State University are all within a short drive. Station Park draws crowds for outdoor concerts and splash-pad nights, while the Heritage Rail Trail winds through green space perfect for biking and weekend strolls. The Franklin County Fairgrounds host events throughout the year, and Heritage Golf Club gives the area a scenic, unhurried backdrop.
Hilliard is a suburban style neighborhood, just a stone’s throw from Columbus.
For upscale home decor located in the heart of Old Downtown Hilliard visit Birch Tree Home.
Tabletop gaming and comic fans can expand their collections at Packrat Comics.
The Urban Market offers affordable clothing for men and women in an awesome environment.
Discover history while you're in Hilliard.
Hilliard the kind of place where people of all ages and interests thrive.
Median Household Income
$102,660
Average: $121,021
Education
15,111
Residents Have a Degree
Job Market
20,941
Workers Employed
Median Age
38 Years
Largest Age Group
35-44 Years
Approximately 15% of Residents
Under 20
26%
Over 65
15%
Housing Distribution
Hilliard has more homeowners than renters.

Education Distribution
Review this city's overall education levels.

As of July 2026, the average apartment rent in Hilliard, OH is $1,058 for a studio, $1,328 for one bedroom, $1,572 for two bedrooms, and $2,189 for three bedrooms. Apartment rent in Hilliard has increased by 1.2% in the past year.
Explore how walkable, bikeable, drivable, and transit-friendly Hilliard, OH is for everyday living.
Fairly Walkable
Walkability
Limited Public Transit
Transit
Exceptionally Drivable
Drivability
Fairly Bikeable
Bikeability
Public
Grades K-5
605 Students

Public
Grades K-5
524 Students

Public
Grades K-5
430 Students
Scioto Darby Elementary School
Public
Grades K-5
385 Students
Hilliard Crossing Elementary School
Public
Grades K-5
520 Students

Hilliard Memorial Middle School
Public
Grades 6-8
771 Students
Public
Grades 6-8
894 Students
Hilliard Heritage Middle School
Public
Grades 6-8
777 Students
Hilliard Station Sixth Grade Elementary School
Public
Grades K-8
768 Students

Public
Grades 9-12
1,770 Students
Public
Grades 9-12
1,605 Students
Public
Grades 9-12
1,570 Students
Public
Grades 9-12
51 Students

† Our analysis of utilities, groceries, transportation, healthcare, home prices, and other goods and services is sourced from the Cost of Living Index, a respected benchmark published by the Council for Community and Economic Research (C2ER) that provides a thorough overview of living expenses across different regions.
Rent data is provided by CoStar Group’s Market Trend reports. As the industry leader in commercial real estate information, analytics, and news, CoStar conducts extensive research to produce and maintain a comprehensive database of commercial real estate information. We combine this data with public record to provide the most up-to-date rental information available.
Consumer goods, services, and home prices are sourced from the Cost of Living Index published by the Council for Community and Economic Research (C2ER). The data on this page is updated quarterly. It was last published in June 2026.
Demographic information comes from Neustar and combines detailed address data with U.S. Census and American Community Survey statistics to produce reliable local estimates.


