
Aspire Apartments
2725 Pavillion Pkwy,
Tracy, CA 95304
$2,150 - $2,999
1-3 Beds
Located in California's Central Valley, Tracy combines comfortable suburban living with convenient access to the San Francisco Bay Area. The city's position between three major interstates makes commuting and travel efficient. Current rental data shows one-bedroom apartments averaging $2,014, offering a more budget-friendly alternative to Bay Area prices. Housing options range from apartment communities in the northeast to residences near downtown, where the historic Tracy Inn has been a landmark since 1927.
Tracy has evolved from its railroad heritage while preserving its community atmosphere. The downtown area features the restored Grand Theatre Center for the Arts, while West Valley Mall serves as a primary shopping destination. The Mediterranean climate makes outdoor recreation enjoyable at Dr. Powers Park and the Tracy Sports Complex. The Tracy Unified School District operates several schools throughout the community. The city's position between three interstate highways has established it as an important transportation hub, reflected in the local saying "Think Inside the Triangle." Throughout the year, Tracy hosts community events and festivals that showcase the city's heritage.
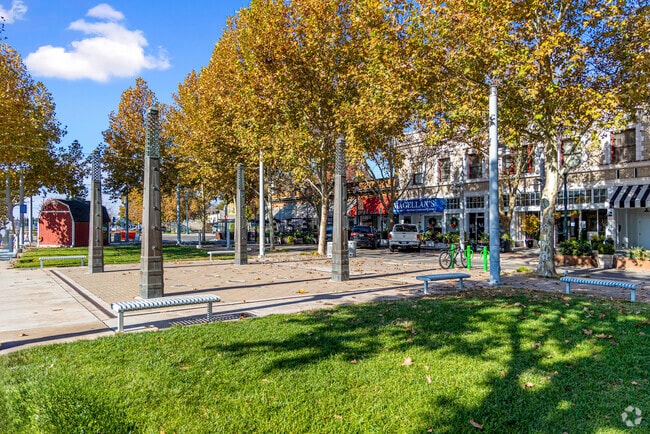
Check out the shops and restaurants in downtown Tracy.
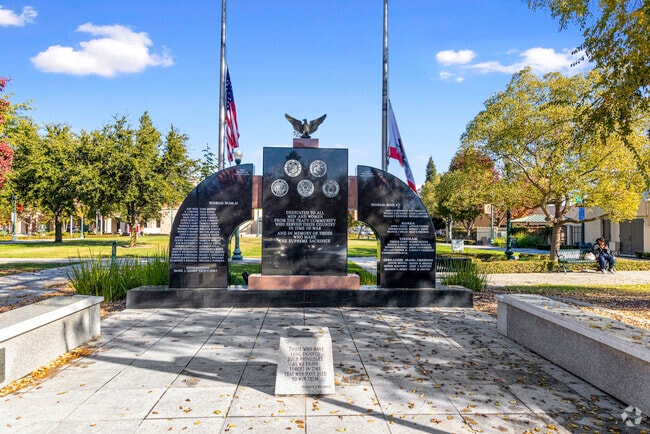
See the WW1 Memorial in Tracy.
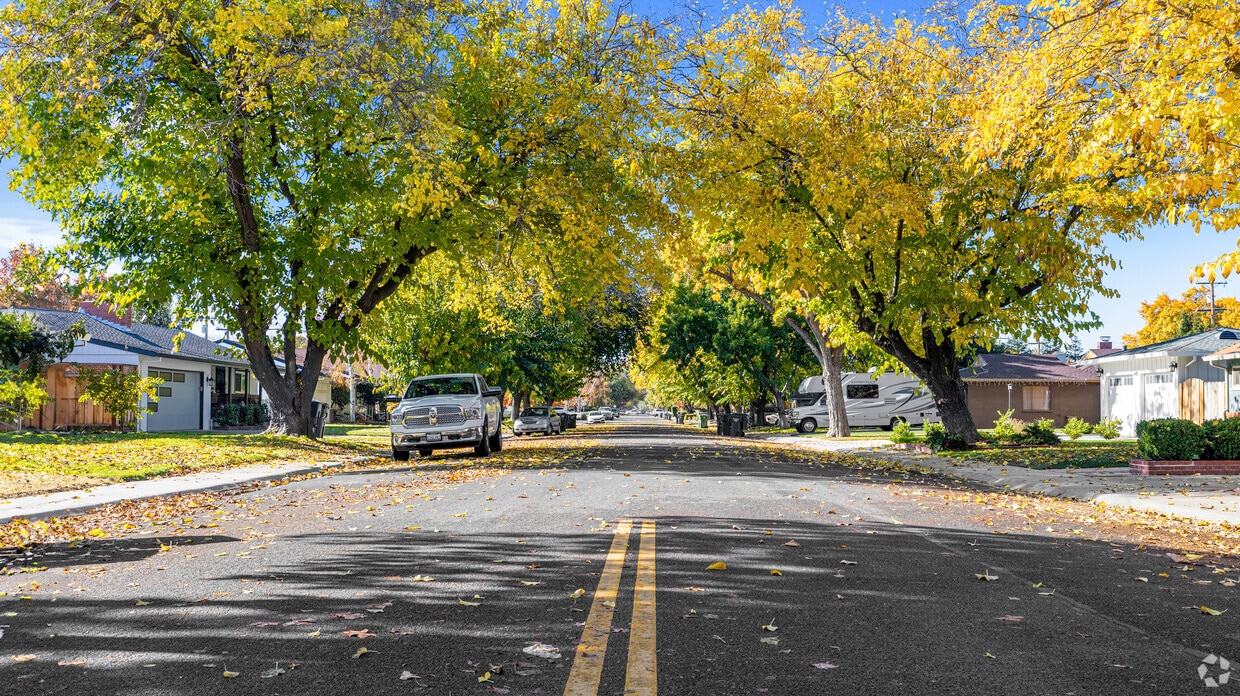
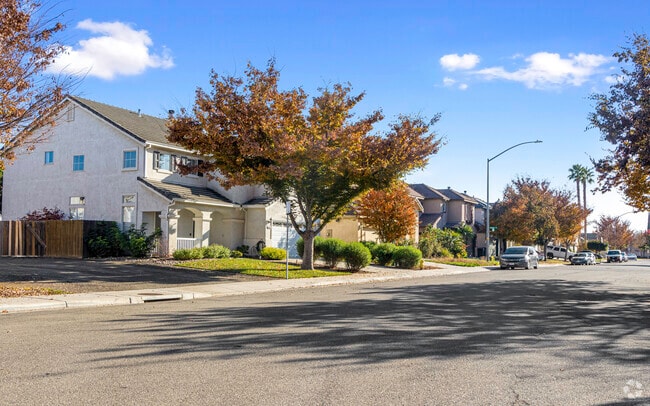
Tracy homes dot the neighborhoods.
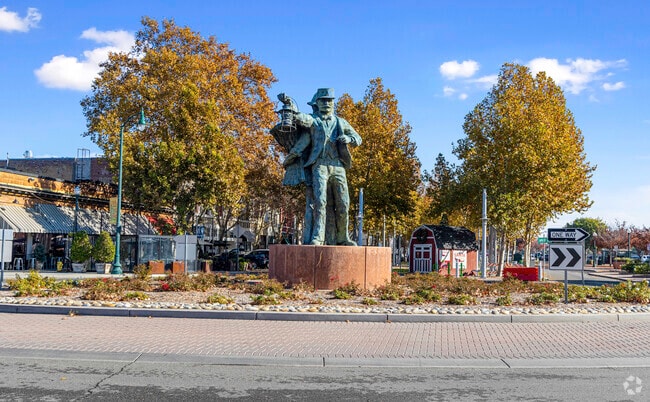
Merchants in Tracy take pride in there city.
Spend time with the family at Dr Powers Park.
Tracy is the second most populated city in San Joaquin County.
As of March 2026, the average apartment rent in Tracy, CA is $1,374 for a studio, $2,086 for one bedroom, $2,358 for two bedrooms, and $3,000 for three bedrooms. Apartment rent in Tracy has increased by 3.6% in the past year.
The cost of living in Tracy, CA is 24.4% higher than the national average. Generally, housing in Tracy is 62.7% more expensive than the national average, with rent falling between $1,374 - $3,000. You can expect to pay 13.6% more for groceries, 14.7% more for utilities, and 15.1% more for transportation.
Explore how walkable, bikeable, drivable, and transit-friendly Tracy, CA is for everyday living.
Car-Dependent
This area is considered a car-dependent area and most errands will require a car.
Minimal Transit
You'll likely want a car when living in this area since it has few transit options.
Somewhat Bikeable
You might be able to find places to ride your bike in this area, but you’ll most likely want your car for most errands.
Public
Grades K-8

Public
Grades K-5
Public
Grades K-8

Gladys Poet-Christian Elementary
Public
Grades K-8

Public
Grades K-8

Public
Grades K-8
Public
Grades K-8
Gladys Poet-Christian Elementary
Public
Grades K-8
Public
Grades 6-8
Public
Grades 6-8
Public
Grades 9-12

Public
Grades 9-12
Public
Grades 9-12
Public
Grades K-12

Public
Grades 9-12
† Our analysis of utilities, groceries, transportation, healthcare, home prices, and other goods and services is sourced from the Cost of Living Index, a respected benchmark published by the Council for Community and Economic Research (C2ER) that provides a thorough overview of living expenses across different regions.
Rent data is provided by CoStar Group’s Market Trend reports. As the industry leader in commercial real estate information, analytics, and news, CoStar conducts extensive research to produce and maintain a comprehensive database of commercial real estate information. We combine this data with public record to provide the most up-to-date rental information available.
Consumer goods, services, and home prices are sourced from the Cost of Living Index published by the Council for Community and Economic Research (C2ER). The data on this page is updated quarterly. It was last published in February 2026.


