Median Age
35 Years
Largest Age Group
10-19 Years
Approximately 16% of Residents
Under 20
30%
Over 65
14%
Avg Rent
$1,515
Population
79,963
Renter Mix
20% Rent
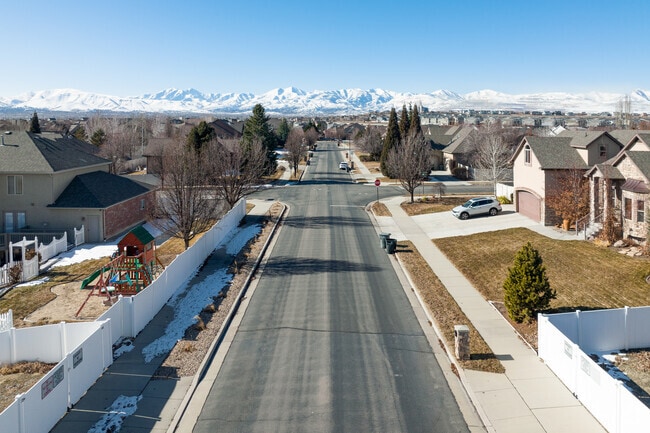
Tucked between the Oquirrh and Wasatch Mountains along the Jordan River, South Jordan offers wide-open landscapes with easy access to Salt Lake City, 20 miles north. The Jordan River Parkway winds through the city with fishing ponds, nature trails, and green space. With 37 parks and Oquirrh Lake within city limits, outdoor recreation is woven into everyday life. The Salt Lake County Fairgrounds and equestrian park add distinct local character, while two TRAX Red Line stations connect residents to downtown without a car.
The rental market includes spacious townhomes, garden-style apartments, and newer multistory developments reflecting the city's steady growth. Many communities feature resort-style amenities and mountain views. Founded in 1859 with agricultural roots, South Jordan has grown into one of the Salt Lake Valley's most sought-after suburban addresses.
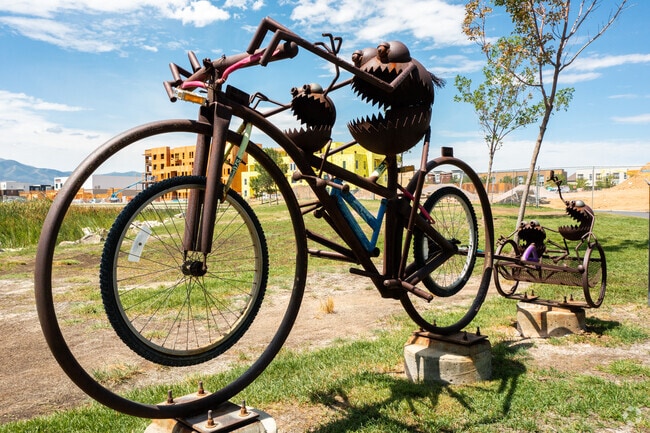
A bicycle sculpture displayed in South Jordan, UT.
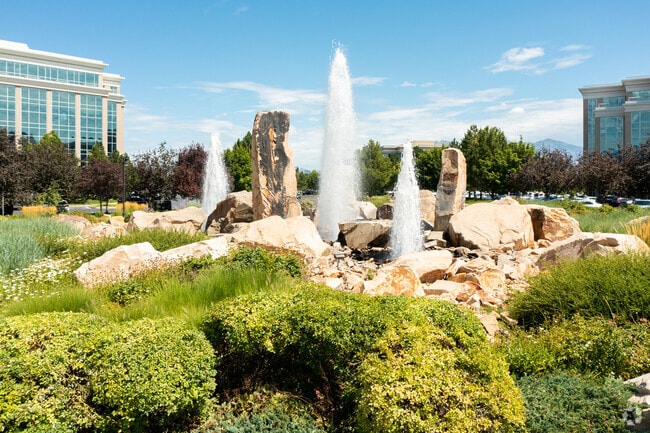
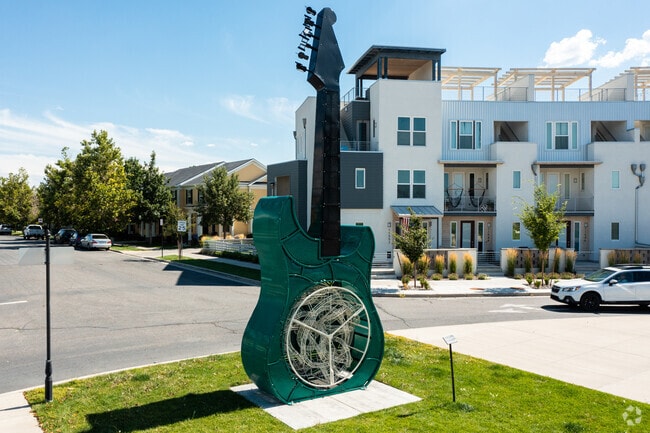
Many interesting sculptures can be found throughout South Jordan, UT.
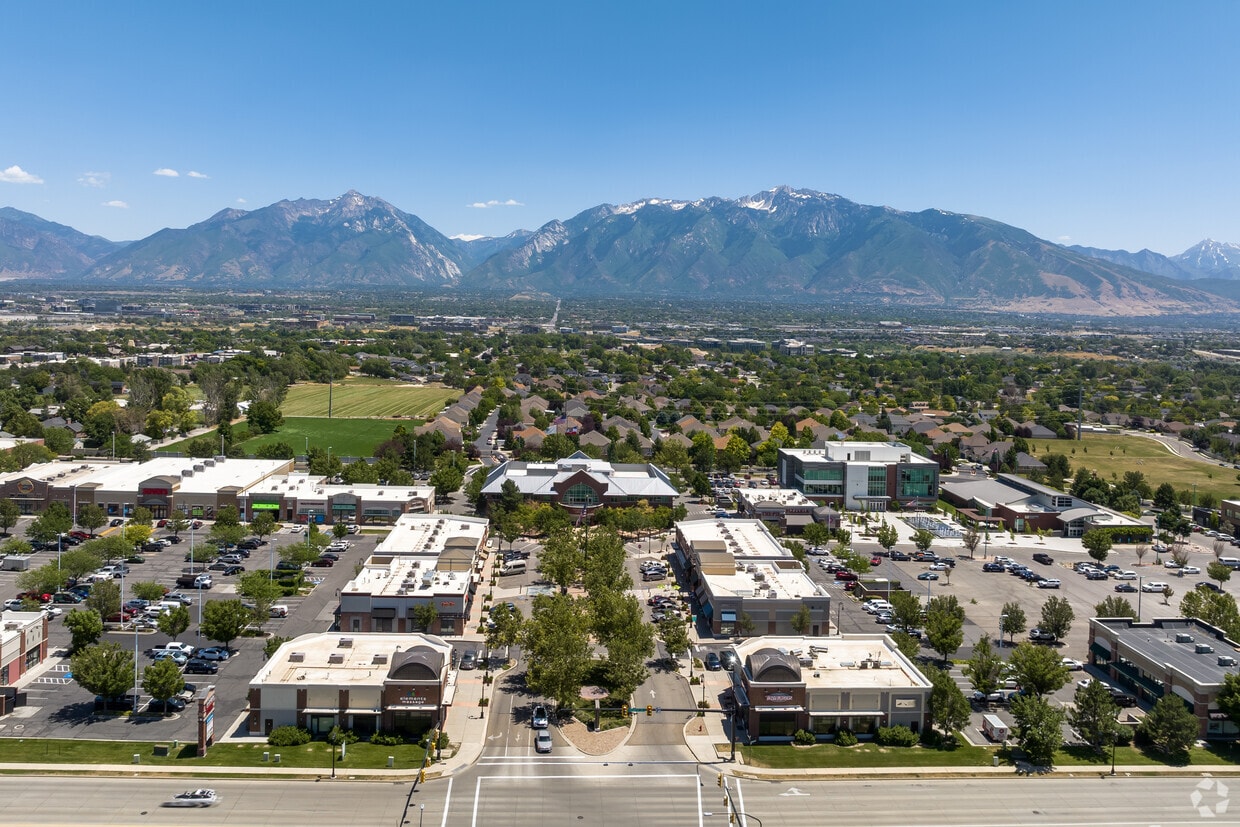
Residents wake up to spectacular views in South Jordan, UT.
Find plenty of retail and restaurant favorites at the local shopping center in South Jordan, UT.
A wooden sign surrounded by lavender at South Jordan City Park.
A grand clock surrounded by trees and metal tables at South River.
Median Household Income
$115,276
Average: $140,217
Education
25,600
Residents Have a Degree
Job Market
43,158
Workers Employed
Median Age
35 Years
Largest Age Group
10-19 Years
Approximately 16% of Residents
Under 20
30%
Over 65
14%
Housing Distribution
South Jordan has more homeowners than renters.

Education Distribution
Review this city's overall education levels.

As of July 2026, the average apartment rent in South Jordan, UT is $1,340 for a studio, $1,510 for one bedroom, $1,878 for two bedrooms, and $2,331 for three bedrooms. Apartment rent in South Jordan has increased by 1.4% in the past year.
Explore how walkable, bikeable, drivable, and transit-friendly South Jordan, UT is for everyday living.
Fairly Walkable
Walkability
Very Drivable
Drivability
Moderately Bikeable
Bikeability
Public
Grades K-5
882 Students

Mountain West Montessori Academy
Public
Grades K-8
450 Students
Early Light Academy At Daybreak
Public
Grades K-8
972 Students

Public
Grades K-5
885 Students
Public
Grades K-5
790 Students
Public
Grades 6-8
1,118 Students

Public
Grades 6-8
1,313 Students
Public
Grades 6-8
1,118 Students
Mountain West Montessori Academy
Public
Grades K-8
450 Students
Public
Grades 6-8
1,249 Students
Public
Grades 9-12
2,482 Students
Public
Grades 9-12
2,461 Students
Public
Grades 6-12
361 Students

American Academy of Innovation
Public
Grades 6-12
373 Students

† Our analysis of utilities, groceries, transportation, healthcare, home prices, and other goods and services is sourced from the Cost of Living Index, a respected benchmark published by the Council for Community and Economic Research (C2ER) that provides a thorough overview of living expenses across different regions.
Rent data is provided by CoStar Group’s Market Trend reports. As the industry leader in commercial real estate information, analytics, and news, CoStar conducts extensive research to produce and maintain a comprehensive database of commercial real estate information. We combine this data with public record to provide the most up-to-date rental information available.
Consumer goods, services, and home prices are sourced from the Cost of Living Index published by the Council for Community and Economic Research (C2ER). The data on this page is updated quarterly. It was last published in June 2026.
Demographic information comes from Neustar and combines detailed address data with U.S. Census and American Community Survey statistics to produce reliable local estimates.


