Median Age
34 Years
Largest Age Group
10-19 Years
Approximately 16% of Residents
Under 20
30%
Over 65
12%


Area Guide
Avg Rent
$1,535
Population
128,995
Renter Mix
19% Rent
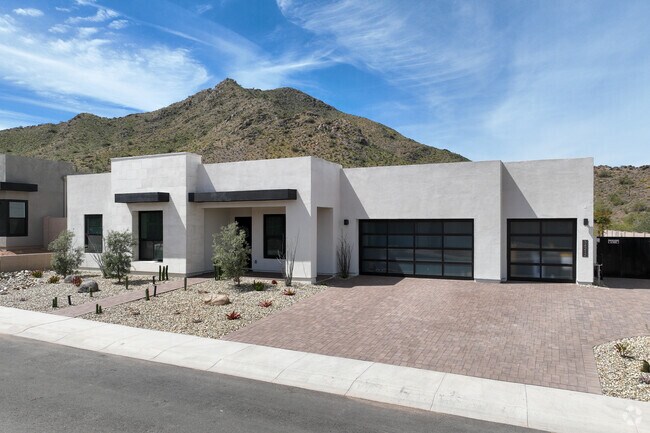
San Tan Valley is a large suburban community positioned about 45 miles southwest of Downtown Phoenix. Primarily a residential area, San Tan Valley serves mainly as a home base for Phoenix-area commuters, and the local rental market is dominated by upscale single-family homes.
Residents enjoy great opportunities to enjoy the region’s year-round sunshine, with several golf courses close at hand and the sprawling San Tan Mountains Regional Park providing an excellent venue for hiking through the region’s rugged natural landscape.
A small cluster of shops along Hunt Highway provides the most convenient resource for picking up groceries or a bite to eat, and larger shopping centers like Queen Creek Marketplace and San Tan Village Marketplace are only a few minutes up the road.
Immerse yourself in the rugged beauty of Arizona's landscape.
Modern custom homes can be seen right at the base of San Tan Mountain.
Golf enthusiasts find their haven at San Tan Highlands Golf Club.
San Tan Mountain Regional Park has trails for hikers, bikers and horseback riders.
Hiking is a popular activity in San Tan Valley.
Median Household Income
$87,073
Average: $97,230
Education
22,862
Residents Have a Degree
Job Market
61,341
Workers Employed
Median Age
34 Years
Largest Age Group
10-19 Years
Approximately 16% of Residents
Under 20
30%
Over 65
12%
Housing Distribution
San Tan Valley has more homeowners than renters.

Education Distribution
Review this city's overall education levels.

As of June 2026, the average apartment rent in San Tan Valley, AZ is $1,532 for one bedroom, $1,856 for two bedrooms, and $2,172 for three bedrooms. Apartment rent in San Tan Valley has decreased by -2.7% in the past year.
Explore how walkable, bikeable, drivable, and transit-friendly San Tan Valley, AZ is for everyday living.
Somewhat Walkable
Walkability
Very Drivable
Drivability
Fairly Bikeable
Bikeability
American Leadership Academy San Tan Valley K-6
Public
Grades K-5
636 Students

Public
Grades PK-5
507 Students

Skyline Ranch Elementary School
Public
Grades PK-8
579 Students

Public
Grades PK-5
382 Students
American Leadership Academy - Ironwood Elementary
Public
Grades K-12
2,083 Students

Public
Grades 6-12
1,176 Students
Public
Grades 6-12
1,308 Students
Skyline Ranch Elementary School
Public
Grades PK-8
579 Students
American Leadership Academy - Ironwood Elementary
Public
Grades K-12
2,083 Students
Public
Grades PK-8
665 Students

Public
Grades 6-12
1,176 Students
Public
Grades 6-12
1,308 Students
American Leadership Academy - Ironwood Elementary
Public
Grades K-12
2,083 Students
Ridgeview College Preparatory High School
Public
Grades 9-12
229 Students
Public
Grades 1-12
200 Students
† Our analysis of utilities, groceries, transportation, healthcare, home prices, and other goods and services is sourced from the Cost of Living Index, a respected benchmark published by the Council for Community and Economic Research (C2ER) that provides a thorough overview of living expenses across different regions.
Rent data is provided by CoStar Group’s Market Trend reports. As the industry leader in commercial real estate information, analytics, and news, CoStar conducts extensive research to produce and maintain a comprehensive database of commercial real estate information. We combine this data with public record to provide the most up-to-date rental information available.
Consumer goods, services, and home prices are sourced from the Cost of Living Index published by the Council for Community and Economic Research (C2ER). The data on this page is updated quarterly. It was last published in June 2026.
Demographic information comes from Neustar and combines detailed address data with U.S. Census and American Community Survey statistics to produce reliable local estimates.


