Median Age
44 Years
Largest Age Group
50-59 Years
Approximately 15% of Residents
Under 20
20%
Over 65
20%

Avg Rent
$1,822
Population
36,931
Renter Mix
54% Rent
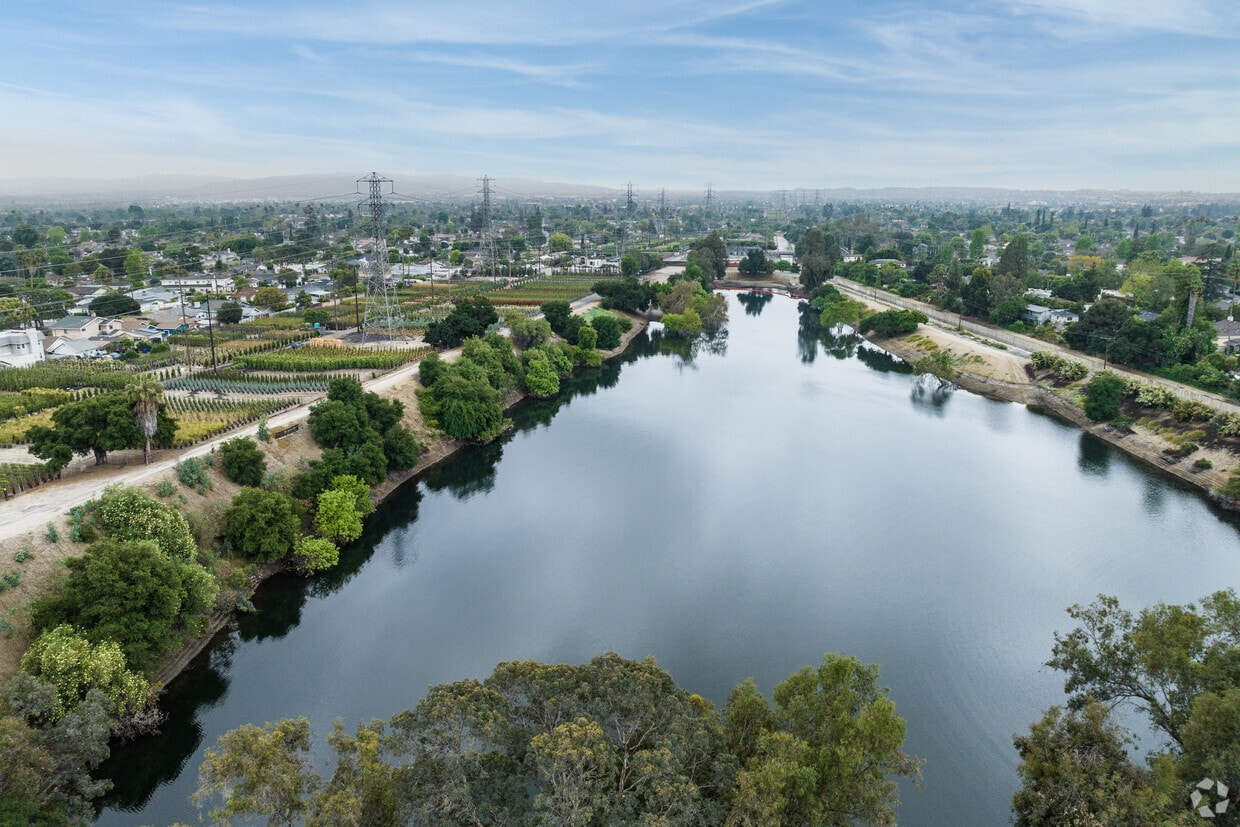
Situated about ten miles northeast of Los Angeles, San Gabriel is a scenic suburb often regarded as the “Birthplace of the Los Angeles Region.” The city boasts a rich history dating back to the 1700s, when the Mission San Gabriel (known as the “Pride of the California Missions”) was founded.
San Gabriel’s historic roots are on display to this day, with the vibrant Mission District serving as the city’s hub of culture, art, and history. City Hall, the San Gabriel Mission Playhouse, and numerous well-maintained Spanish Colonial Revival style buildings are the cornerstones of the District. A host of diverse eateries, cafes, offices, shops, and museums—including the famed San Gabriel Mission—are also found in this vibrant downtown area.
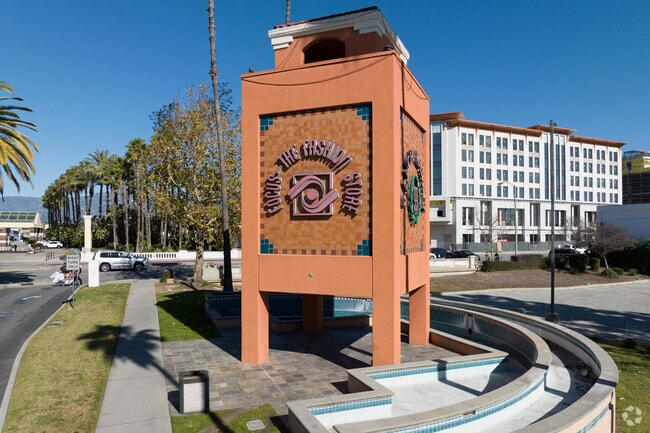
Area residents enjoy a bevy of outdoor activities at Vincent Lugo Park, Smith Park, and San Gabriel Country Club. Retail destinations like the Shops on Lake Avenue, the Shops at Montebello, and Westfield Santa Anita are all within a short drive of the city, affording residents access to endless shopping opportunities.
San Gabriel is also convenient to area attractions such as the California Institute of Technology (Caltech), Santa Anita Park, and the Los Angeles County Arboretum and Botanic Garden. Direct access to the 10 freeway makes commuting to Downtown LA from San Gabriel easy.
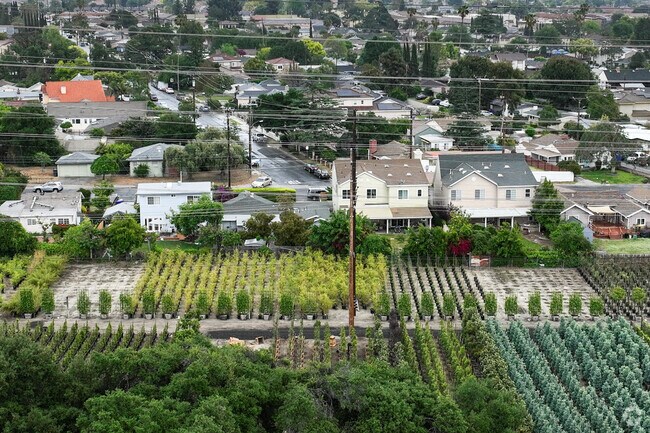
Ranch-style homes back up to this tree nursery in San Gabriel.
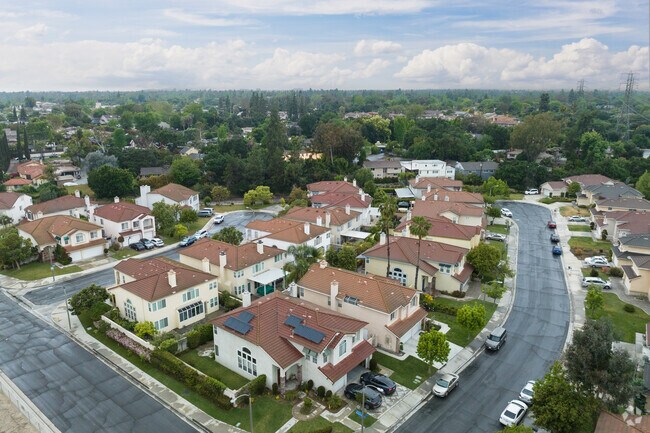
Mediterranean style community in East San Gabriel
SF Supermarket is the place to go for fresh produce in San Gabriel.
Median Household Income
$81,225
Average: $104,008
Education
11,795
Residents Have a Degree
Job Market
18,477
Workers Employed
Median Age
44 Years
Largest Age Group
50-59 Years
Approximately 15% of Residents
Under 20
20%
Over 65
20%
Housing Distribution
San Gabriel has more renters than homeowners.

Education Distribution
Review this city's overall education levels.

As of July 2026, the average apartment rent in San Gabriel, CA is $1,882 for a studio, $1,822 for one bedroom, $2,233 for two bedrooms, and $3,009 for three bedrooms. Apartment rent in San Gabriel has decreased by -0.2% in the past year.
Explore how walkable, bikeable, drivable, and transit-friendly San Gabriel, CA is for everyday living.
Moderately Walkable
Walkability
Limited Public Transit
Transit
Very Drivable
Drivability
Fairly Bikeable
Bikeability
Public
Grades K-5
650 Students

Public
Grades K-5
650 Students
Public
Grades K-5
401 Students

Public
Grades K-5
379 Students
Public
Grades K-5
401 Students

Public
Grades 6-8
1,013 Students
Public
Grades 6-8
1,013 Students
Public
Grades 9-12
1,438 Students
Public
Grades 9-12
1,438 Students
Public
Grades 9-12
1,761 Students
Public
Grades 9-12
1,761 Students
Public
Grades 9-12
36 Students

† Our analysis of utilities, groceries, transportation, healthcare, home prices, and other goods and services is sourced from the Cost of Living Index, a respected benchmark published by the Council for Community and Economic Research (C2ER) that provides a thorough overview of living expenses across different regions.
Rent data is provided by CoStar Group’s Market Trend reports. As the industry leader in commercial real estate information, analytics, and news, CoStar conducts extensive research to produce and maintain a comprehensive database of commercial real estate information. We combine this data with public record to provide the most up-to-date rental information available.
Consumer goods, services, and home prices are sourced from the Cost of Living Index published by the Council for Community and Economic Research (C2ER). The data on this page is updated quarterly. It was last published in June 2026.
Demographic information comes from Neustar and combines detailed address data with U.S. Census and American Community Survey statistics to produce reliable local estimates.


