Median Age
43 Years
Largest Age Group
50-59 Years
Approximately 14% of Residents
Under 20
20%
Over 65
20%
Avg Rent
$1,350
Population
47,779
Renter Mix
53% Rent
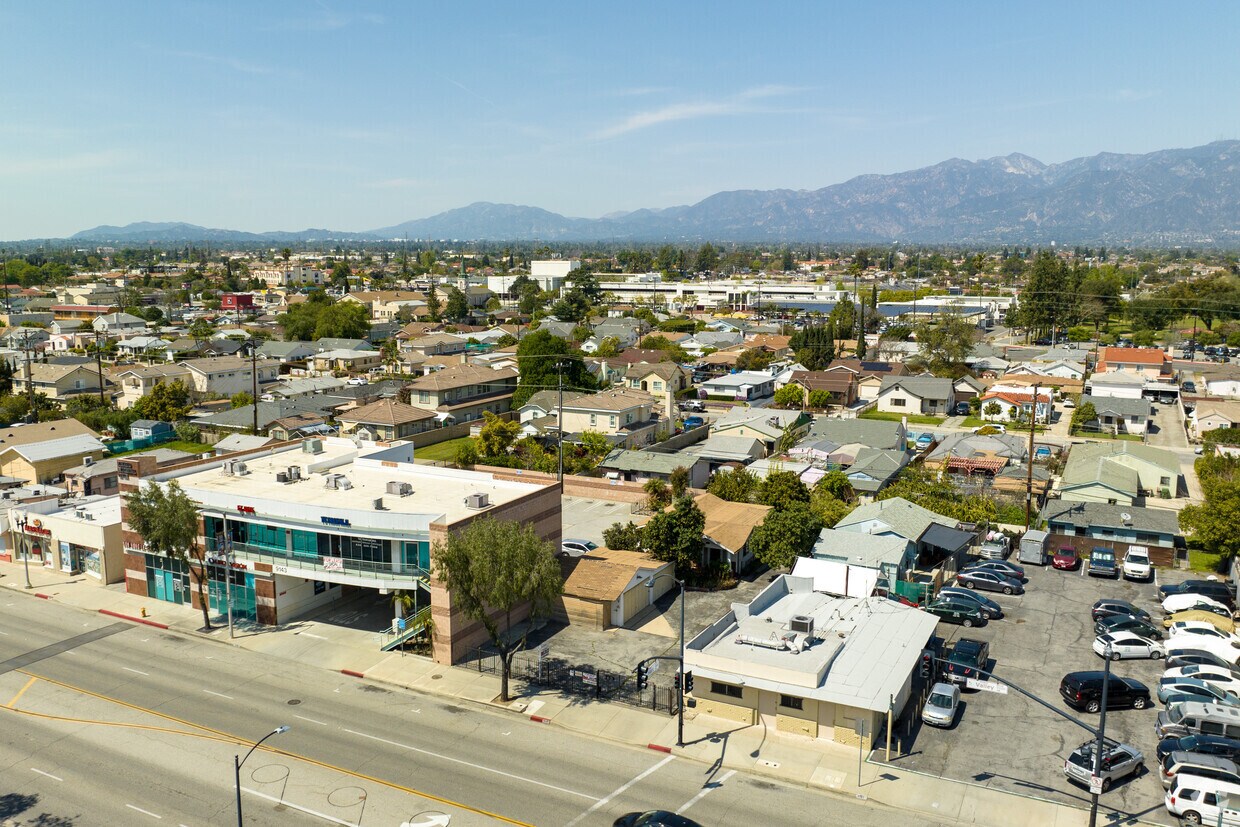
Rosemead is a pleasant city that keeps a small-town charm despite being 11 miles away from Los Angeles and Pasadena. With mountains on the horizon, palm trees lining the streets, and an average of 285 sunny days a year, Rosemead highlights the best of California. The community is dotted with parks, golf courses, and bike paths that let residents enjoy the outdoors. Apart from sunny weather, Rosemead residents enjoy shopping at the Shops at Montebello and being just minutes away from California State University. The rest of Rosemead remains relatively residential. Renters have choices of apartments, houses, and condos that are sure to suit just about anyone’s style.
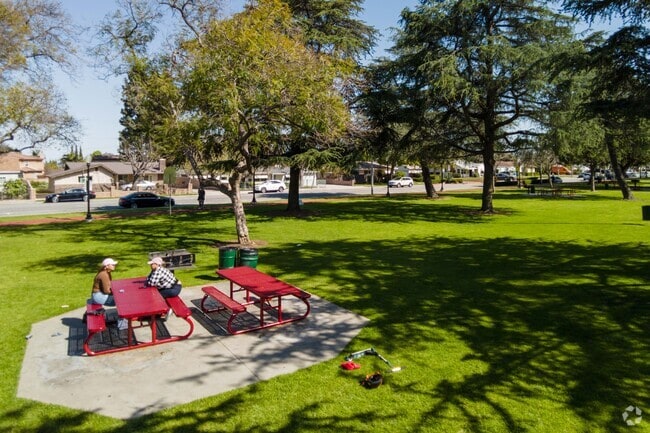
Rosemead Park Is a great place to relax and enjoy the nice California weather
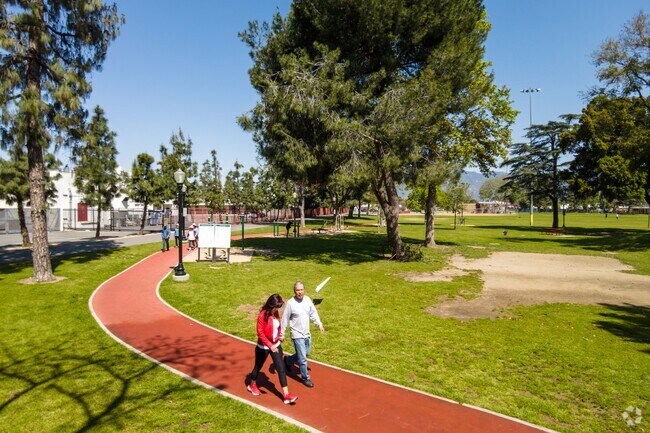
Rosemeade park in California has plenty of recreational space from running paths to ball fields.
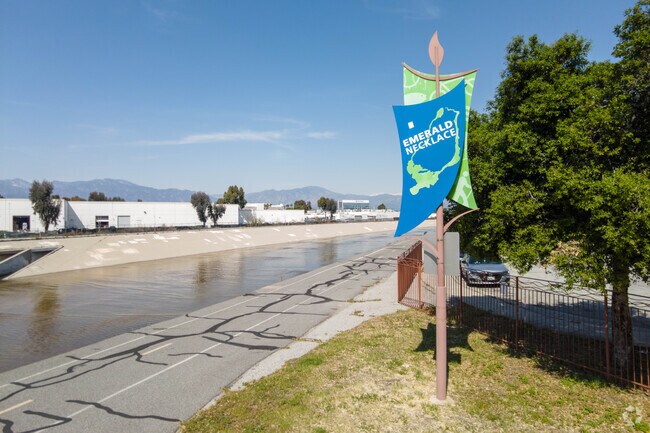
Rio Hondo Trail is a great running and bike path along the emerald necklace.
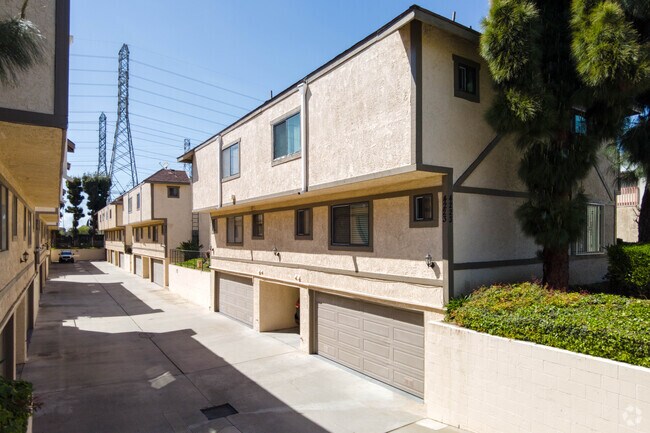
Lawns are well manicured and landscaping is meticulously maintained throughout Rosemead.
There is plenty of grass and large open areas for dogs to play at Garvey Park in Rosemead.
Rosemead sits just East of Los Angeles, about 20 minutes away.
Median Household Income
$66,491
Average: $86,446
Education
10,479
Residents Have a Degree
Job Market
22,694
Workers Employed
Median Age
43 Years
Largest Age Group
50-59 Years
Approximately 14% of Residents
Under 20
20%
Over 65
20%
Housing Distribution
Rosemead has more renters than homeowners.

Education Distribution
Review this city's overall education levels.

As of July 2026, the average apartment rent in Rosemead, CA is $1,200 for a studio, $1,350 for one bedroom, $1,747 for two bedrooms, and $2,646 for three bedrooms. Apartment rent in Rosemead has increased by 1.0% in the past year.
Explore how walkable, bikeable, drivable, and transit-friendly Rosemead, CA is for everyday living.
Moderately Walkable
Walkability
Some Public Transit
Transit
Exceptionally Drivable
Drivability
Moderately Bikeable
Bikeability
Public
Grades K-5
575 Students

Mildred B. Janson Elementary School
Public
Grades K-5
575 Students
Emma W. Shuey Elementary School
Public
Grades K-5
450 Students

Emerson (Ralph Waldo) Elementary
Public
Grades K-5
390 Students
Emerson (Ralph Waldo) Elementary School
Public
Grades K-5
390 Students
Public
Grades 6-8
511 Students
Public
Grades 6-8
661 Students
Public
Grades 6-8
511 Students
Temple (Roger W.) Intermediate
Public
Grades 6-8
297 Students
Public
Grades 9-12
1,691 Students
Public
Grades 9-12
1,691 Students
† Our analysis of utilities, groceries, transportation, healthcare, home prices, and other goods and services is sourced from the Cost of Living Index, a respected benchmark published by the Council for Community and Economic Research (C2ER) that provides a thorough overview of living expenses across different regions.
Rent data is provided by CoStar Group’s Market Trend reports. As the industry leader in commercial real estate information, analytics, and news, CoStar conducts extensive research to produce and maintain a comprehensive database of commercial real estate information. We combine this data with public record to provide the most up-to-date rental information available.
Consumer goods, services, and home prices are sourced from the Cost of Living Index published by the Council for Community and Economic Research (C2ER). The data on this page is updated quarterly. It was last published in June 2026.
Demographic information comes from Neustar and combines detailed address data with U.S. Census and American Community Survey statistics to produce reliable local estimates.


