Median Age
45 Years
Largest Age Group
55-64 Years
Approximately 14% of Residents
Under 20
20%
Over 65
23%
Area Guide
Avg Rent
$1,552
Population
57,414
Renter Mix
48% Rent
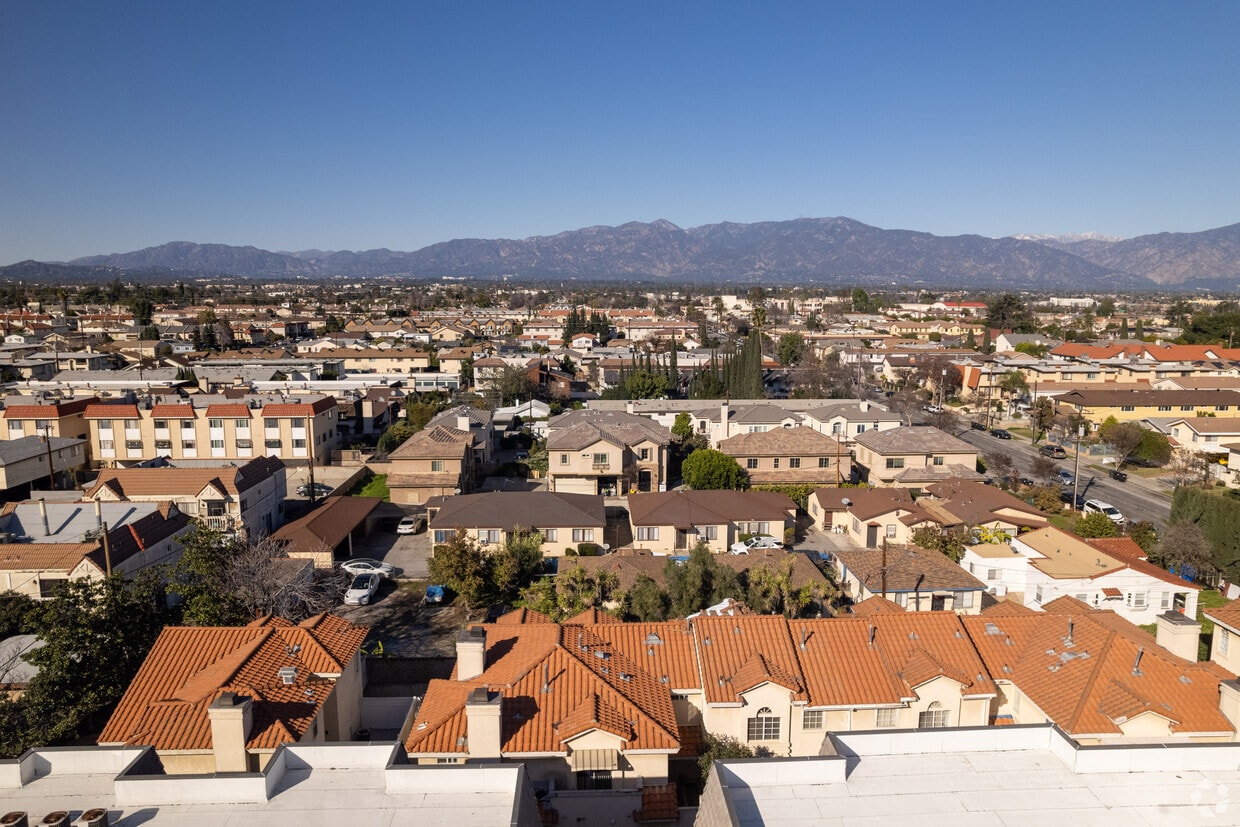
Nestled in the San Gabriel Valley, Monterey Park is just eight miles east of Los Angeles. The commercial districts on Atlantic Boulevard and Garvey Avenue are teeming with restaurants specializing in Asian cuisine, along with markets, shops, and salons.
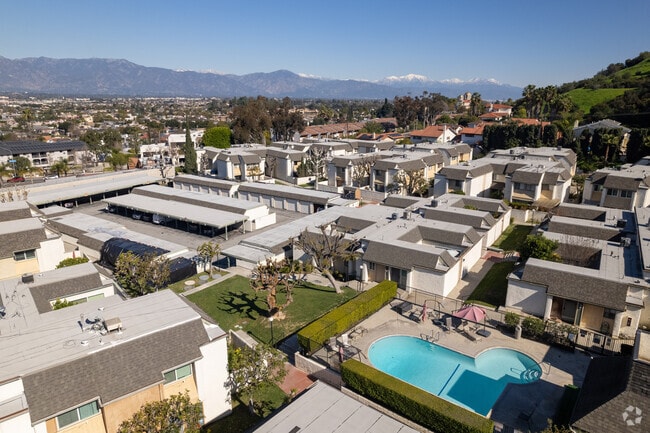
Several parks in town offer residents a peaceful reprieve from busy modern life. Monterey Park residents enjoy relaxing and engaging in outdoor recreation at Barnes Park, Sequoia Park, and Garvey Ranch Park. Lively events draw the community together in Monterey Park, including the Cherry Blossom Festival, Geranium Festival, Cinco de Mayo Celebration, and Lunar New Year Festival. Convenient freeway access brings Monterey Park residents to the many amenities of Downtown Los Angeles in 15 minutes.
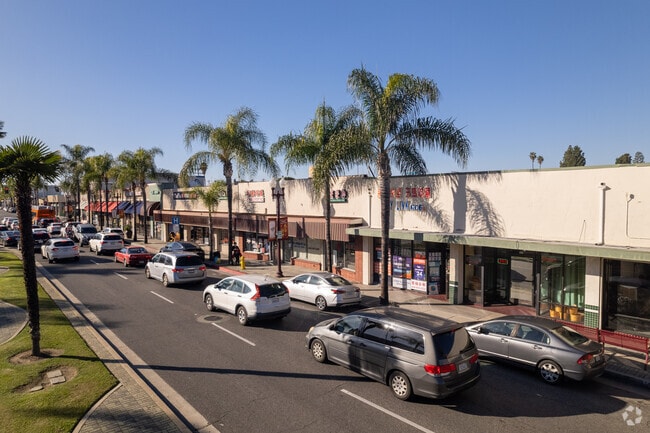
Monterey Park is well-known among Angelenos for its East Asian shopping and dining.
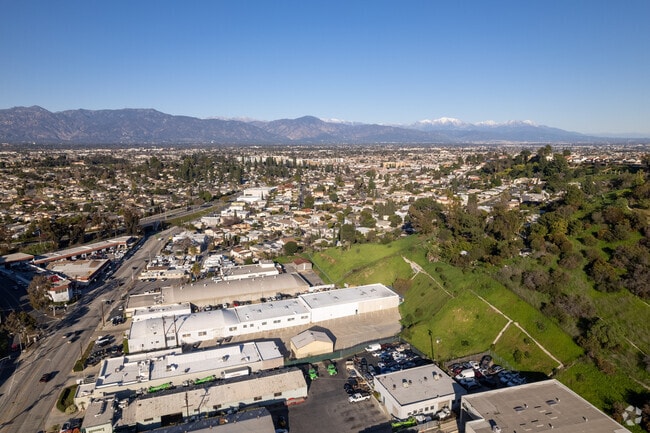
A view of the industrial area facing the main area of Monterey Park.
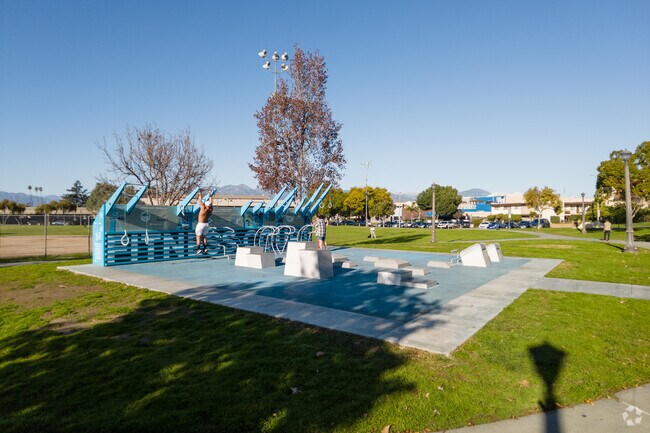
When locals need exercise, they can head to one of Monterey Park’s many well-maintained parks.
It's easy to get around in Monterey Park, whether by foot or public transit.
Cascades Park in Monterey Park is a great spot for a picnic and to unwind.
Local farmers proudly display their seasonal harvests at Monterey Park's farmers market.
Median Household Income
$74,673
Average: $99,211
Education
18,423
Residents Have a Degree
Job Market
26,359
Workers Employed
Median Age
45 Years
Largest Age Group
55-64 Years
Approximately 14% of Residents
Under 20
20%
Over 65
23%
Housing Distribution
Monterey Park has more homeowners than renters.

Education Distribution
Review this city's overall education levels.

As of June 2026, the average apartment rent in Monterey Park, CA is $1,135 for a studio, $1,552 for one bedroom, $1,849 for two bedrooms, and $2,062 for three bedrooms. Apartment rent in Monterey Park has increased by 3.1% in the past year.
Explore how walkable, bikeable, drivable, and transit-friendly Monterey Park, CA is for everyday living.
Fairly Walkable
Walkability
Limited Public Transit
Transit
Exceptionally Drivable
Drivability
Somewhat Bikeable
Bikeability
Monterey Highlands Elementary School
Public
Grades K-8
917 Students

Public
Grades K-8
917 Students

Public
Grades K-8
804 Students
Public
Grades K-8
804 Students

Public
Grades K-8
695 Students
Monterey Highlands Elementary School
Public
Grades K-8
917 Students
Public
Grades K-8
917 Students
Public
Grades K-8
804 Students
Public
Grades K-8
804 Students
Public
Grades K-8
695 Students
† Our analysis of utilities, groceries, transportation, healthcare, home prices, and other goods and services is sourced from the Cost of Living Index, a respected benchmark published by the Council for Community and Economic Research (C2ER) that provides a thorough overview of living expenses across different regions.
Rent data is provided by CoStar Group’s Market Trend reports. As the industry leader in commercial real estate information, analytics, and news, CoStar conducts extensive research to produce and maintain a comprehensive database of commercial real estate information. We combine this data with public record to provide the most up-to-date rental information available.
Consumer goods, services, and home prices are sourced from the Cost of Living Index published by the Council for Community and Economic Research (C2ER). The data on this page is updated quarterly. It was last published in June 2026.
Demographic information comes from Neustar and combines detailed address data with U.S. Census and American Community Survey statistics to produce reliable local estimates.


