Median Age
46 Years
Largest Age Group
55-64 Years
Approximately 15% of Residents
Under 20
19%
Over 65
24%

Avg Rent
$2,464
Population
31,620
Renter Mix
25% Rent
Whether it’s a historic presence you crave, or a wealth of family fun activities, you’ll find it all in Salem! The town is part of Rockingham County, adjacent to Interstate 93. Residents enjoy proximity to the Mall at Rockingham Park, which happens to be the largest mall in the state of New Hampshire. Purchasing local goods can be accomplished at the Salem NH Farmers Market. When it comes to family outings, nothing beats Canobie Lake Parks’ roller coasters, stunt shows, live music, and games.
History is prevalent in Salem, too. Canobie Lake Park was built in 1902 as a means to encourage travel by trolley to the park’s leisure amenities. The park was successful and became a renowned New England resort. Are you familiar with Stonehenge? Well, Salem has one as well. America’s Stonehenge occupies almost 30 acres in Salem. Many theories surround the origin of the stone structure; its purpose was discovered to be an astronomical calendar.
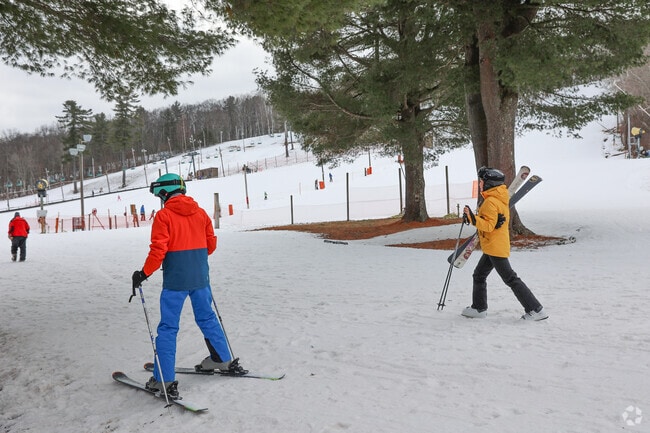
Skiers in Boxford enjoy time at nearby Bradford Ski.
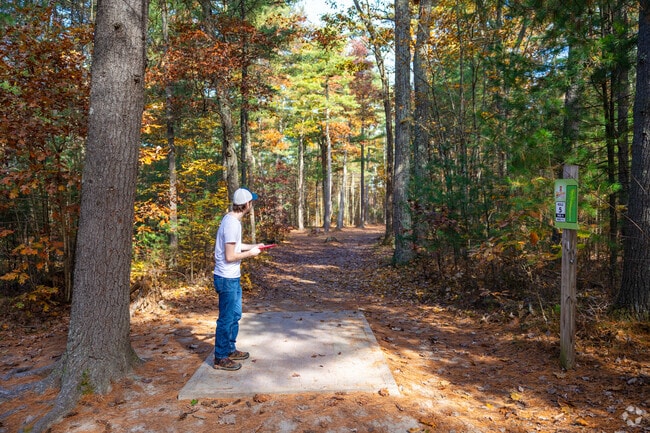
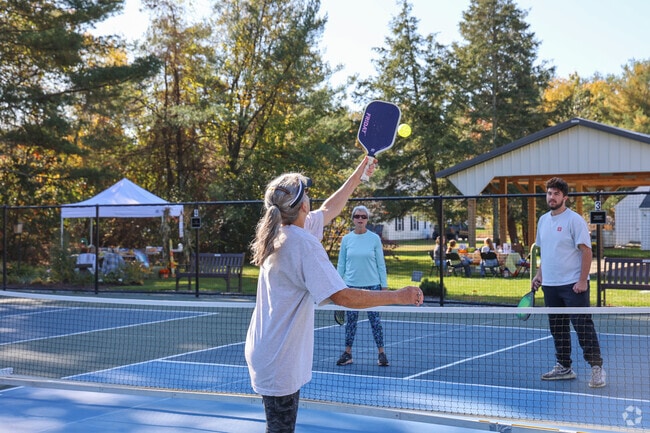
Spend the day playing with friends at the Pelham Fall Festival.
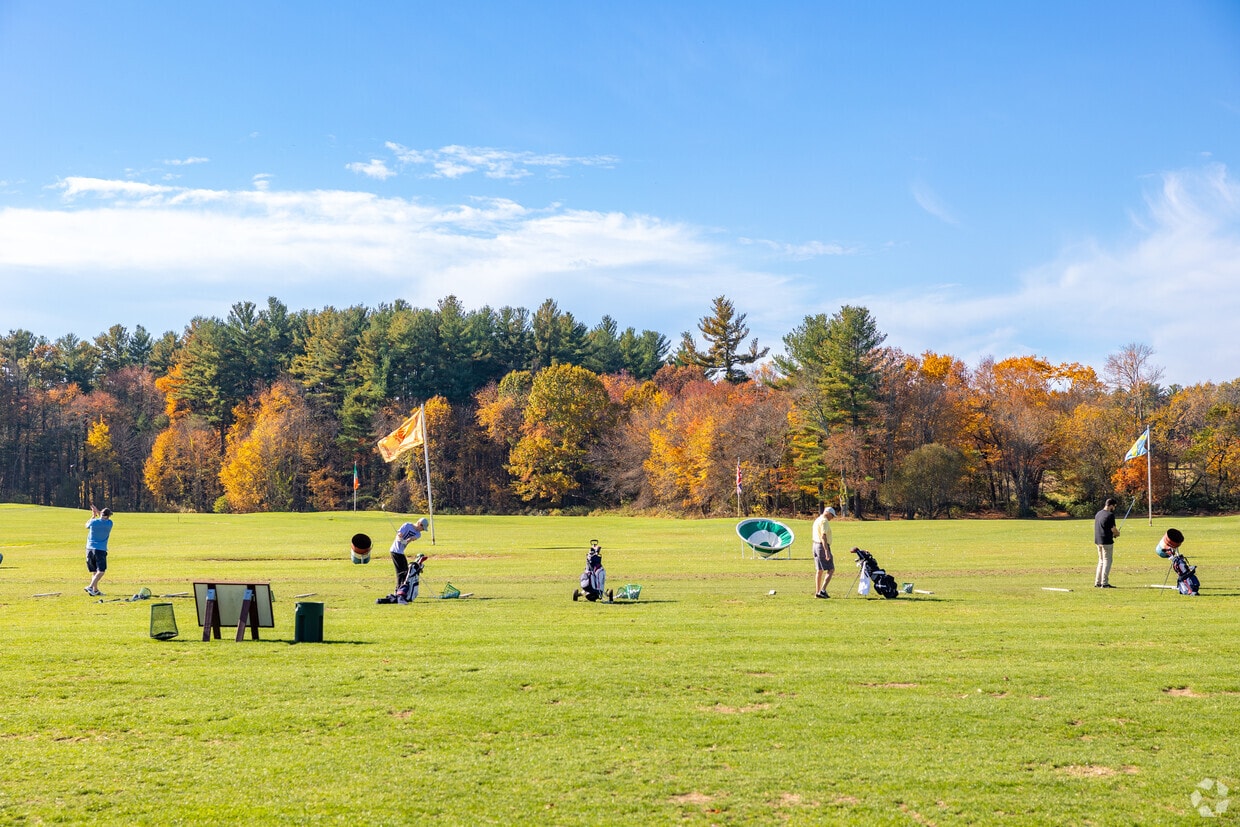
Residents can connect well with the baseballs at the Jay Gee's batting cages near The East End.
Median Household Income
$101,432
Average: $119,333
Education
10,184
Residents Have a Degree
Job Market
18,700
Workers Employed
Median Age
46 Years
Largest Age Group
55-64 Years
Approximately 15% of Residents
Under 20
19%
Over 65
24%
Housing Distribution
Salem has more homeowners than renters.

Education Distribution
Review this city's overall education levels.

As of July 2026, the average apartment rent in Salem, NH is $2,088 for a studio, $2,464 for one bedroom, $2,873 for two bedrooms, and $4,250 for three bedrooms. Apartment rent in Salem has decreased by -6.2% in the past year.
Explore how walkable, bikeable, drivable, and transit-friendly Salem, NH is for everyday living.
Fairly Walkable
Walkability
Exceptionally Drivable
Drivability
Somewhat Bikeable
Bikeability
William T. Barron Elementary School
Public
Grades K-5
377 Students

Mary A. Fisk Elementary School
Public
Grades K-5
272 Students

Public
Grades K-5
270 Students
Public
Grades K-5
366 Students

The Birches Academy of Academics and Art
Public
Grades K-8
286 Students
Public
Grades 6-8
777 Students
The Birches Academy of Academics and Art
Public
Grades K-8
286 Students
Public
Grades 9-12
1,116 Students
Arts Academy of New Hampshire Chartered Public High School
Public
Grades 9-12
106 Students

† Our analysis of utilities, groceries, transportation, healthcare, home prices, and other goods and services is sourced from the Cost of Living Index, a respected benchmark published by the Council for Community and Economic Research (C2ER) that provides a thorough overview of living expenses across different regions.
Rent data is provided by CoStar Group’s Market Trend reports. As the industry leader in commercial real estate information, analytics, and news, CoStar conducts extensive research to produce and maintain a comprehensive database of commercial real estate information. We combine this data with public record to provide the most up-to-date rental information available.
Consumer goods, services, and home prices are sourced from the Cost of Living Index published by the Council for Community and Economic Research (C2ER). The data on this page is updated quarterly. It was last published in June 2026.
Demographic information comes from Neustar and combines detailed address data with U.S. Census and American Community Survey statistics to produce reliable local estimates.


