10 Most Affordable Places to Live in New Jersey
Experience all New Jersey offers without breaking the bank. Here are 10 cities with the cheapest rent in the state.
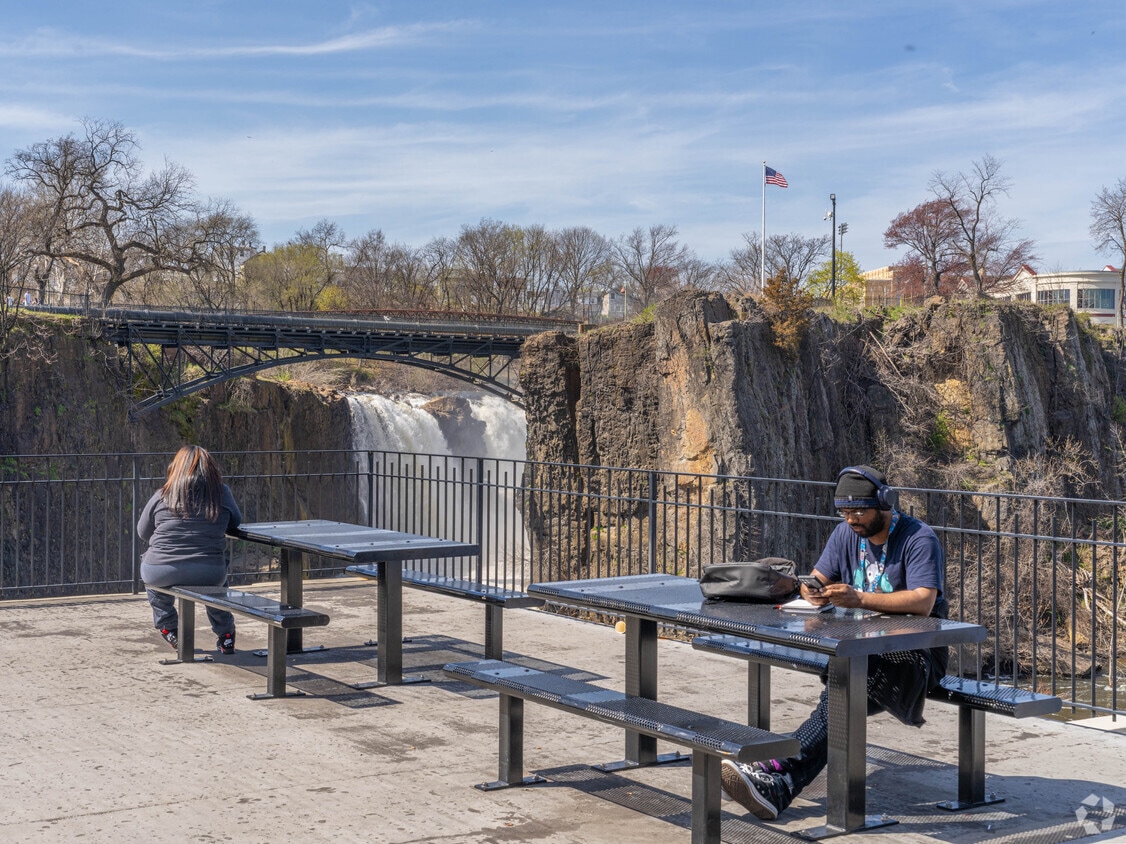
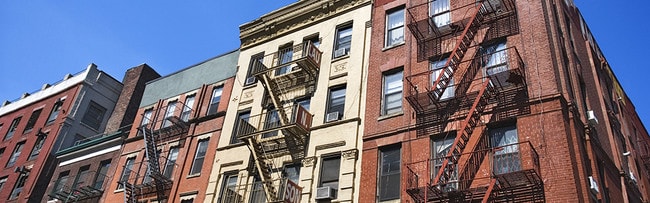
Paterson, New Jersey combines metropolitan convenience with historical significance. Located 15 miles from New York City, this city features housing options from historic brownstones to contemporary apartment communities. The rental market remains steady, with average rents of $1,412 for one-bedroom units showing a modest annual increase of 2.5%. Two-bedroom apartments average $1,835, making Paterson a cost-effective alternative to surrounding metropolitan areas.
The Great Falls Historic District anchors the community, featuring the impressive Great Falls of the Passaic River - a National Historical Park that highlights the city's industrial heritage. The Paterson Museum, located in the former Rogers Locomotive Works building, preserves and showcases local history through industrial artifacts and exhibitions. South Paterson features Mediterranean and South American influences, with markets and cafes along Main Street and Market Street. The Eastside Park Historic District showcases preserved architecture surrounding the 66-acre park. Downtown Paterson combines historical Beaux-Arts buildings with contemporary developments, including the Center City Mall.
As of March 2026, the average apartment rent in Paterson, NJ is $1,104 for a studio, $1,420 for one bedroom, $1,860 for two bedrooms, and $2,249 for three bedrooms. Apartment rent in Paterson has increased by 1.0% in the past year.
Experience all New Jersey offers without breaking the bank. Here are 10 cities with the cheapest rent in the state.
Explore how walkable, bikeable, drivable, and transit-friendly Paterson, NJ is for everyday living.
Very Walkable
If you enjoy walking, you’ll enjoy renting in this area! It’s a very walkable neighborhood.
Good Transit
The area around this property has good transit with many nearby transportation options.
Somewhat Bikeable
You might be able to find places to ride your bike in this area, but you’ll most likely want your car for most errands.
Public
Grades PK-8

Community Charter School Of Paterson
Public
Grades K-8

Public
Grades PK-8
Public
Grades K-5

Public
Grades K-8
Public
Grades PK-8
Community Charter School Of Paterson
Public
Grades K-8
Public
Grades PK-8
Public
Grades K-8
Public
Grades PK-8
Paterson Charter School for Science & Technology
Public
Grades K-12
Public
Grades 9-12
Public
Grades 9-12
Public
Grades 9-12
Paterson Arts And Science Charter School
Public
Grades K-12

68
Communities
20,227
Units
42
Cities

715
Communities
198,674
Units
340
Cities
391
Communities
108,446
Units
239
Cities

159
Communities
26,767
Units
111
Cities

51
Communities
6,213
Units
35
Cities

37
Communities
3,842
Units
30
Cities
† Our analysis of utilities, groceries, transportation, healthcare, home prices, and other goods and services is sourced from the Cost of Living Index, a respected benchmark published by the Council for Community and Economic Research (C2ER) that provides a thorough overview of living expenses across different regions.
Rent data is provided by CoStar Group’s Market Trend reports. As the industry leader in commercial real estate information, analytics, and news, CoStar conducts extensive research to produce and maintain a comprehensive database of commercial real estate information. We combine this data with public record to provide the most up-to-date rental information available.
Consumer goods, services, and home prices are sourced from the Cost of Living Index published by the Council for Community and Economic Research (C2ER). The data on this page is updated quarterly. It was last published in February 2026.


