Median Age
42 Years
Largest Age Group
35-44 Years
Approximately 14% of Residents
Under 20
22%
Over 65
19%
Avg Rent
$2,317
Population
20,916
Renter Mix
44% Rent
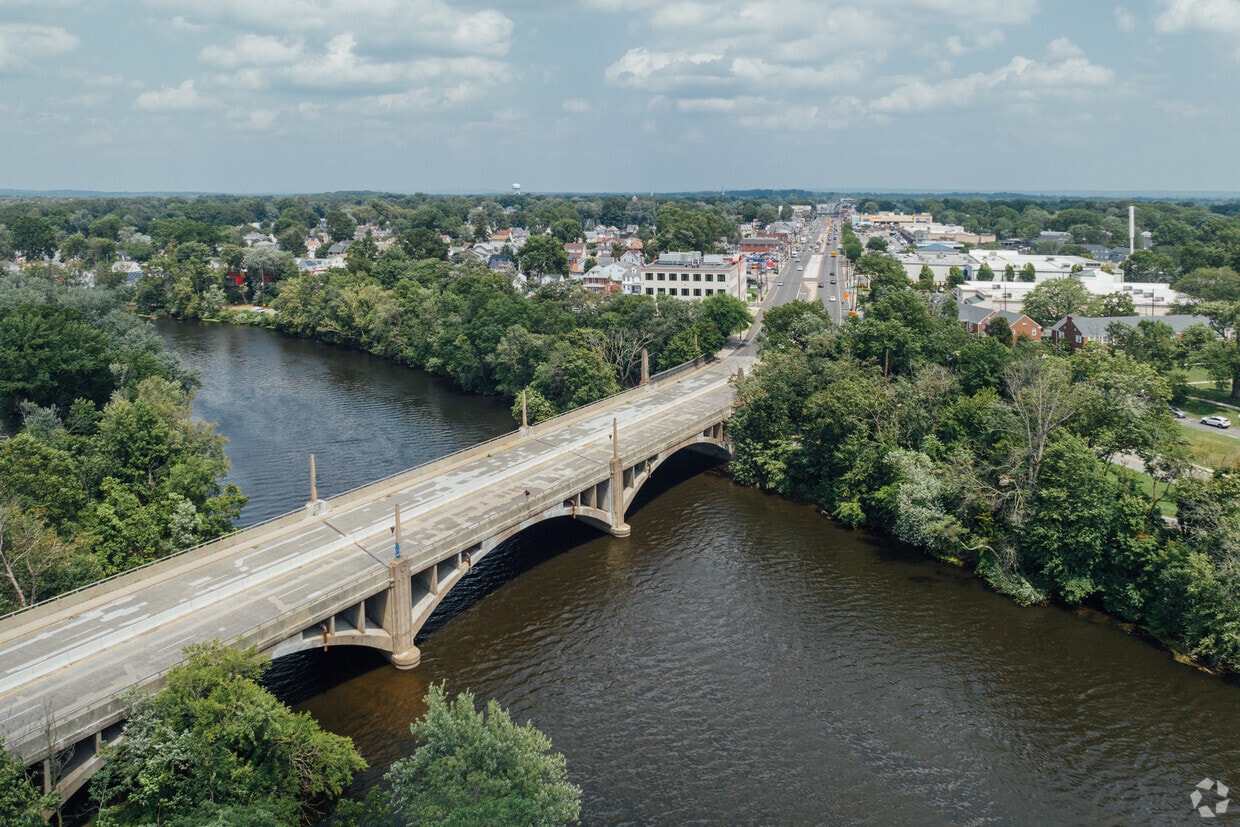
Nestled alongside the Passaic River, Elmwood Park is a peaceful suburb near all kinds of natural offerings as well as the world-class amenities of New York City. In addition to a host of city parks, Elmwood Park is convenient to recreational destinations like East Side Park, Saddle River County Park, Garrett Mountain Reservation, and Paterson Great Falls National Historical Park.
Elmwood Park residents enjoy quick access to a variety of diverse cuisine in town and a myriad of shopping opportunities at the nearby Outlets at Bergen Town Center and Westfield Garden State Plaza. Getting around from Elmwood Park is a breeze with convenience to I-80, the Garden State Parkway, and the Broadway NJ Transit train station.
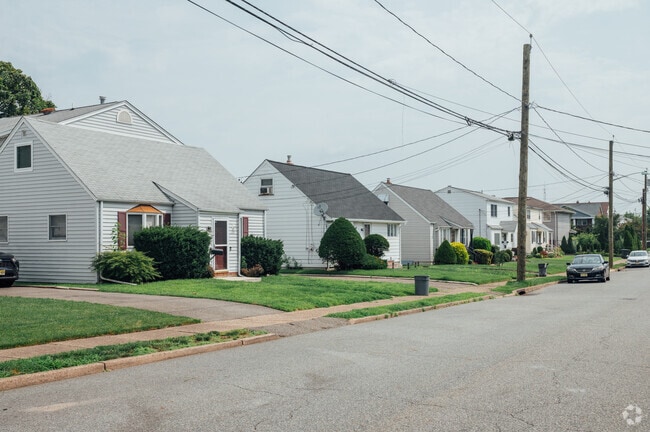
Cape Cods are one of the main styles of houses in Elmwood Park, NJ.
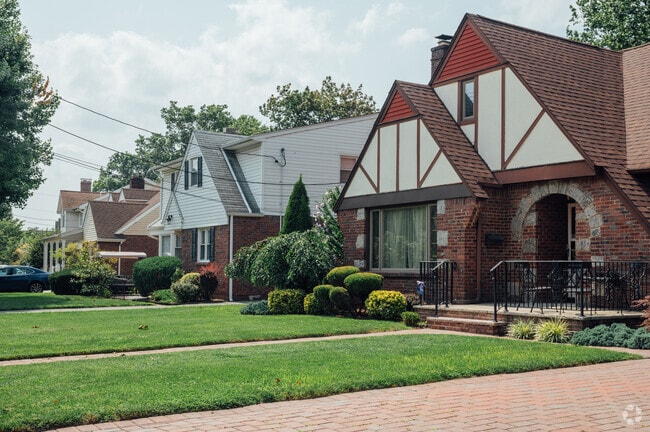
Extensive brickwork combines with Tudor style to bring charm to Elmwood Park, NJ.
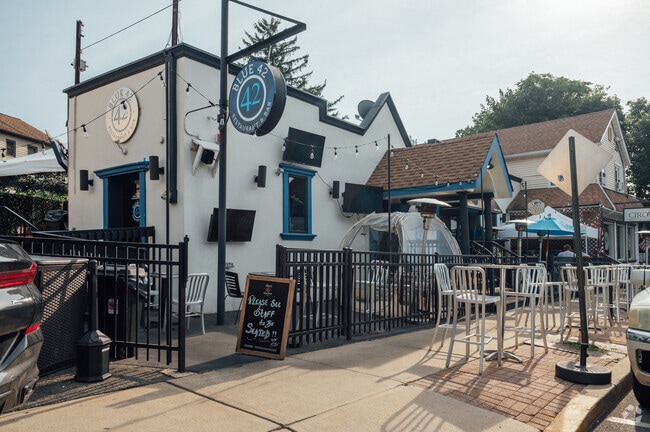
Blue 42 is a laid back sports bar with a karaoke in Elmwood Park.
The Elmwood Park Shopping Center on Broadway offers chain shops like Walgreens and Hook & Reel.
Artesian Fields County Park is a 40-acre hidden gem with walking paths.
Gall Ave Park features a baseball field, basketball court, and a playground in Elmwood Park, NJ.
Median Household Income
$76,344
Average: $98,939
Education
5,749
Residents Have a Degree
Job Market
11,079
Workers Employed
Median Age
42 Years
Largest Age Group
35-44 Years
Approximately 14% of Residents
Under 20
22%
Over 65
19%
Housing Distribution
Elmwood Park has more homeowners than renters.

Education Distribution
Review this city's overall education levels.

As of July 2026, the average apartment rent in Elmwood Park, NJ is $2,291 for one bedroom, $2,384 for two bedrooms, and $3,482 for three bedrooms. Apartment rent in Elmwood Park has decreased by -1.2% in the past year.
Explore how walkable, bikeable, drivable, and transit-friendly Elmwood Park, NJ is for everyday living.
Moderately Walkable
Walkability
Some Public Transit
Transit
Very Drivable
Drivability
Fairly Bikeable
Bikeability
Sixteenth Avenue Elementary School
Public
Grades PK-5
410 Students

Gantner Avenue Elementary School
Public
Grades K-5
339 Students
Gilbert Avenue Elementary School
Public
Grades PK-5
456 Students

Public
Grades 6-8
579 Students

Public
Grades 9-12
806 Students
† Our analysis of utilities, groceries, transportation, healthcare, home prices, and other goods and services is sourced from the Cost of Living Index, a respected benchmark published by the Council for Community and Economic Research (C2ER) that provides a thorough overview of living expenses across different regions.
Rent data is provided by CoStar Group’s Market Trend reports. As the industry leader in commercial real estate information, analytics, and news, CoStar conducts extensive research to produce and maintain a comprehensive database of commercial real estate information. We combine this data with public record to provide the most up-to-date rental information available.
Consumer goods, services, and home prices are sourced from the Cost of Living Index published by the Council for Community and Economic Research (C2ER). The data on this page is updated quarterly. It was last published in June 2026.
Demographic information comes from Neustar and combines detailed address data with U.S. Census and American Community Survey statistics to produce reliable local estimates.


