Median Age
35 Years
Largest Age Group
25-34 Years
Approximately 16% of Residents
Under 20
26%
Over 65
12%

Avg Rent
$2,464
Population
38,311
Renter Mix
46% Rent
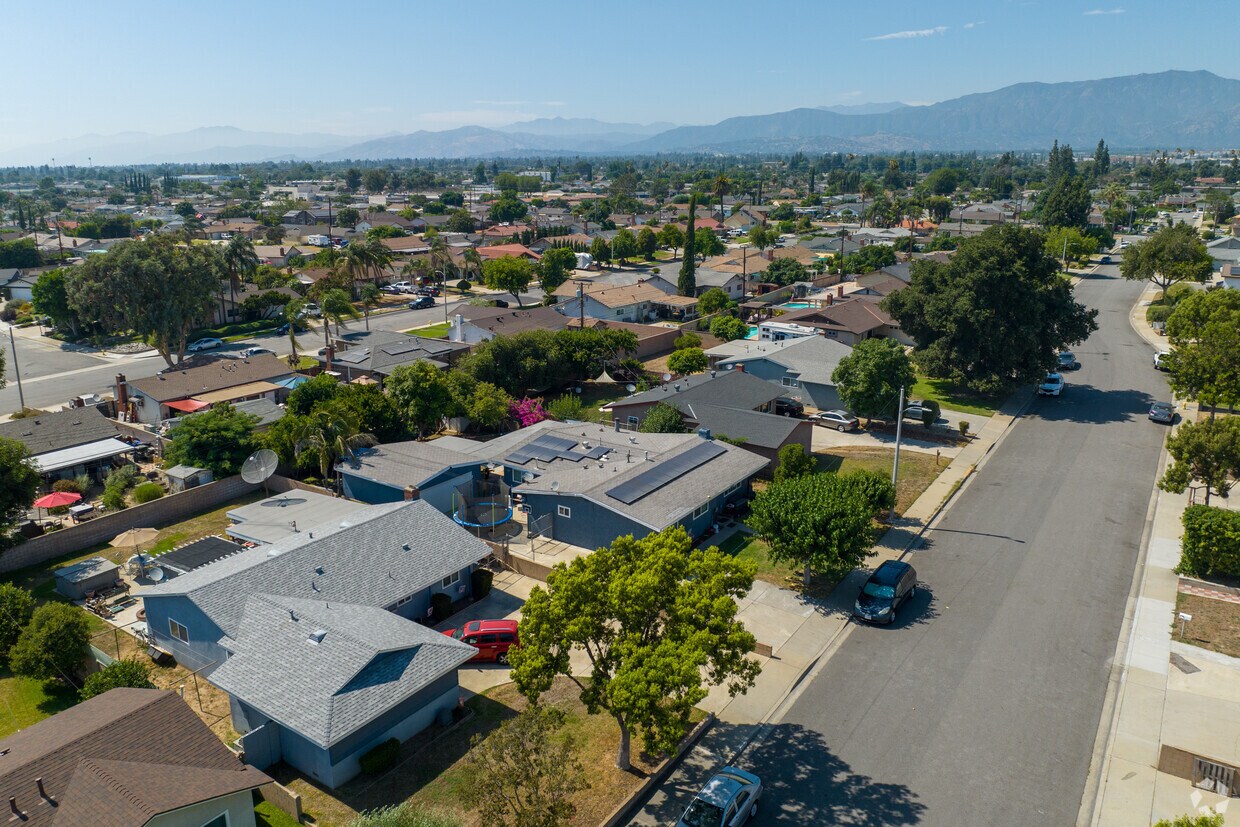
Situated 33 miles east of Los Angeles in Pomona Valley, Montclair is a bustling city in the southwestern side of San Bernardino County. The San Bernardino Freeway runs through the top half of the city connecting Montclair to other parts of the region. Most of Montclair is made up of residential developments with a variety of apartments and single-family homes for rent. The city’s residential avenues are paired with commercial developments like Montclair Place, a shopping mall that’s home to a theater and countless shops and restaurants. Just south of the shopping mall sits the Montclair Hospital Medical Center, which not only provides quality healthcare but an abundance of jobs. Other great features of Montclair include parks like Alma Hoffman Park, a drive-in theater, and local restaurants and bars.
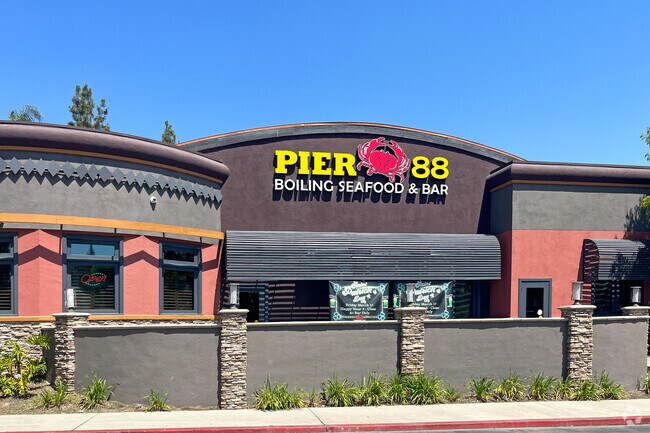
Pier 88 serves seafood favorites inside Montclair Place shopping center.
Find retail stores and eateries at Montclair Place, a popular local destination.
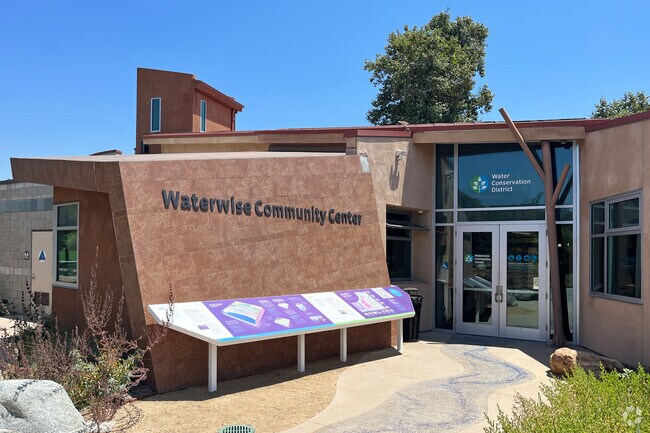
The entrance to Waterwise Community Center Gardens highlights sustainable landscaping in Montclair.
Waterwise Community Center in Montclair features a tranquil pond among native plants.
Learn about sustainable gardening at the Waterwise Community Center’s education space.
Alma Hofman Park offers a playground alongside athletic fields and picnic spots.
Median Household Income
$72,770
Average: $88,886
Education
6,032
Residents Have a Degree
Job Market
18,126
Workers Employed
Median Age
35 Years
Largest Age Group
25-34 Years
Approximately 16% of Residents
Under 20
26%
Over 65
12%
Housing Distribution
Montclair has more homeowners than renters.

Education Distribution
Review this city's overall education levels.

As of July 2026, the average apartment rent in Montclair, CA is $2,139 for a studio, $2,459 for one bedroom, $2,608 for two bedrooms, and $3,393 for three bedrooms. Apartment rent in Montclair has increased by 5.9% in the past year.
Explore how walkable, bikeable, drivable, and transit-friendly Montclair, CA is for everyday living.
Fairly Walkable
Walkability
Limited Public Transit
Transit
Exceptionally Drivable
Drivability
Somewhat Bikeable
Bikeability
Public
Grades K-5
535 Students

Public
Grades K-5
535 Students
Public
Grades K-5
564 Students

Public
Grades K-5
564 Students
Public
Grades K-5
433 Students

Public
Grades 6-8
657 Students
Public
Grades 6-8
657 Students
Public
Grades 6-8
580 Students

Public
Grades 6-8
580 Students
Public
Grades 9-12
2,515 Students

Public
Grades 9-12
2,515 Students
† Our analysis of utilities, groceries, transportation, healthcare, home prices, and other goods and services is sourced from the Cost of Living Index, a respected benchmark published by the Council for Community and Economic Research (C2ER) that provides a thorough overview of living expenses across different regions.
Rent data is provided by CoStar Group’s Market Trend reports. As the industry leader in commercial real estate information, analytics, and news, CoStar conducts extensive research to produce and maintain a comprehensive database of commercial real estate information. We combine this data with public record to provide the most up-to-date rental information available.
Consumer goods, services, and home prices are sourced from the Cost of Living Index published by the Council for Community and Economic Research (C2ER). The data on this page is updated quarterly. It was last published in June 2026.
Demographic information comes from Neustar and combines detailed address data with U.S. Census and American Community Survey statistics to produce reliable local estimates.


