Median Age
35 Years
Largest Age Group
30-39 Years
Approximately 16% of Residents
Under 20
27%
Over 65
12%

Area Guide
Avg Rent
$2,024
Population
179,298
Renter Mix
45% Rent
Located in Southern California's Inland Empire, Ontario combines residential comfort with city conveniences. The rental market currently shows moderate growth, with average rents ranging from $1,645 for studios to $2,903 for three-bedroom homes, reflecting a year-over-year increase between 0.2% and 6.4%. The New Haven neighborhood offers newer residential developments, while established communities near downtown provide a mix of housing options. The area around Ontario Mills features apartment communities with quick access to shopping and entertainment.
Ontario's strategic location and amenities make it an appealing choice for renters. Ontario International Airport serves as a major employment center, while Ontario Mills mall provides extensive shopping options. The Toyota Arena hosts year-round entertainment events, from concerts to sporting competitions. Outdoor enthusiasts can explore nearby San Gabriel Mountains trails, and the city maintains several public parks, including Cucamonga-Guasti Regional Park. The historic Chaffey High School campus stands as a testament to Ontario's educational heritage, dating back to the city's establishment in 1882. Today, Ontario serves as an important economic center in the Inland Empire, building upon its agricultural roots while embracing modern development.
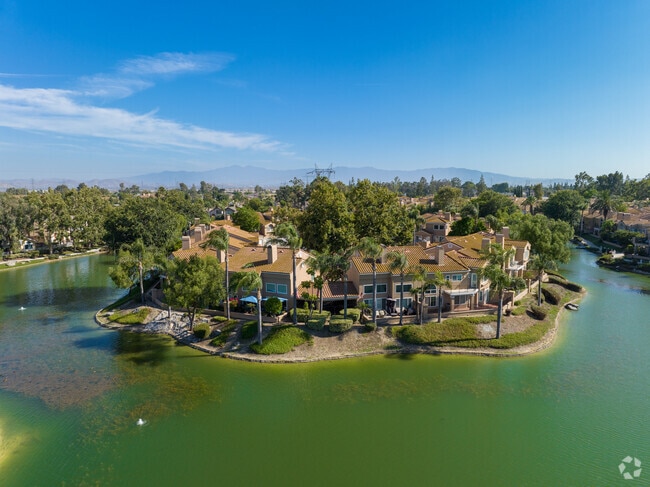
Experience serene lakeside living in the homes of Ontario Ranch.
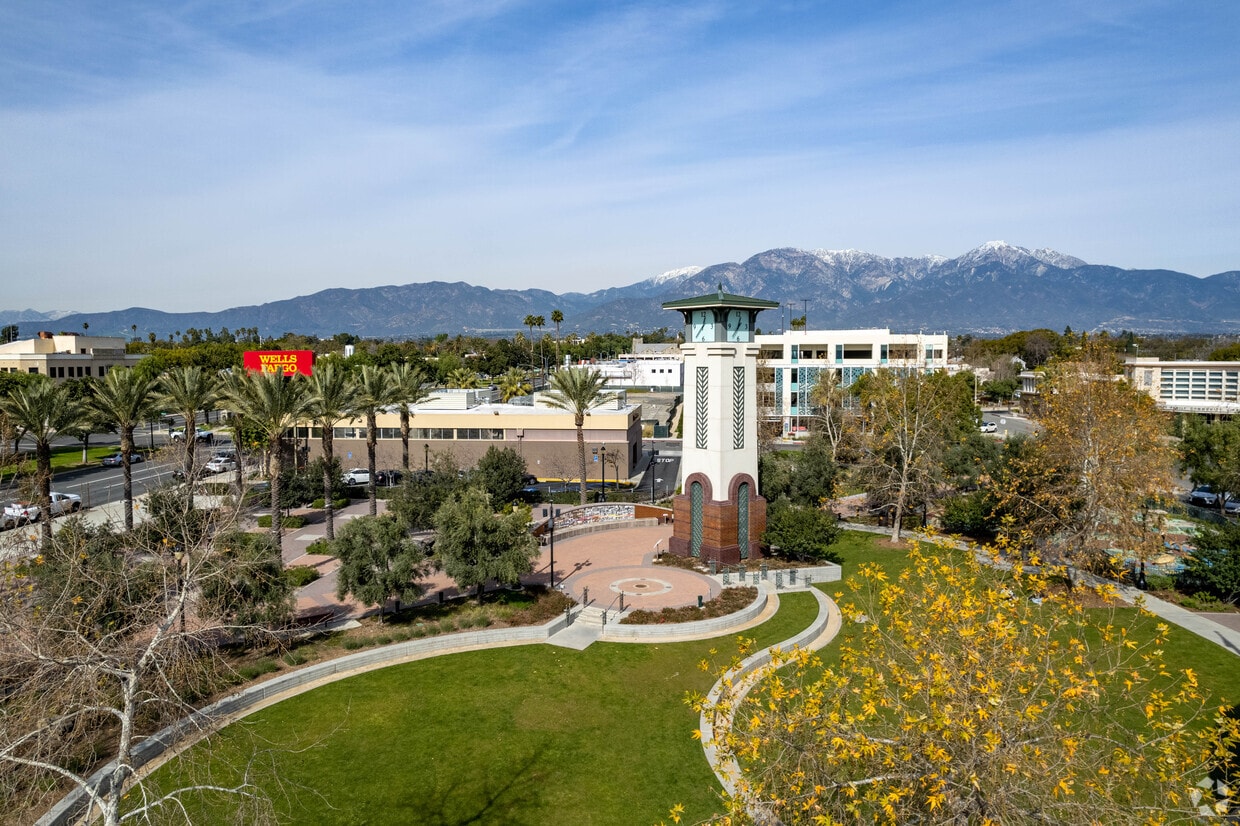
Art in the park.
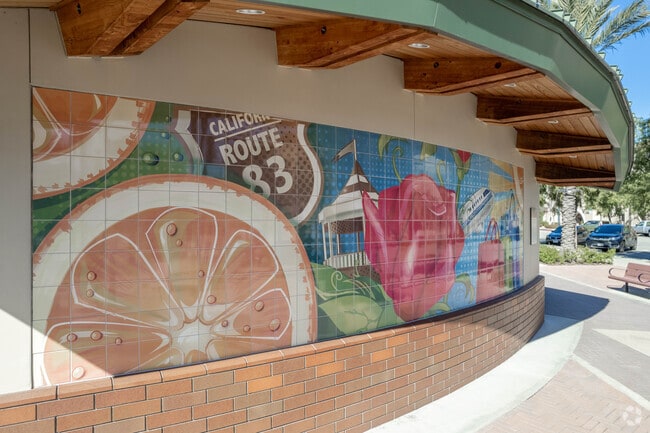
Downtown Ontario leans into its heritage with art deco and Craftsman styling.
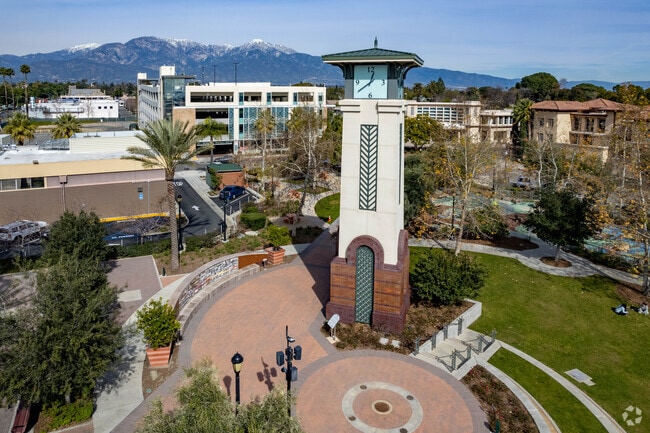
View of Conservation Park.
Homes in Ontario are nestled amongst the foothills of the surrounding mountain ranges.
Along with ample green space, some parks in Ontario feature excellent waterscapes.
Median Household Income
$81,866
Average: $97,695
Education
32,560
Residents Have a Degree
Job Market
90,611
Workers Employed
Median Age
35 Years
Largest Age Group
30-39 Years
Approximately 16% of Residents
Under 20
27%
Over 65
12%
Housing Distribution
Ontario has more homeowners than renters.

Education Distribution
Review this city's overall education levels.

As of July 2026, the average apartment rent in Ontario, CA is $1,567 for a studio, $2,029 for one bedroom, $2,473 for two bedrooms, and $2,856 for three bedrooms. Apartment rent in Ontario has increased by 1.6% in the past year.
Explore how walkable, bikeable, drivable, and transit-friendly Ontario, CA is for everyday living.
Fairly Walkable
Walkability
Exceptionally Drivable
Drivability
Somewhat Bikeable
Bikeability
Public
Grades K-5
844 Students

Public
Grades K-8
736 Students

Public
Grades K-5
578 Students
Public
Grades K-5
578 Students
Public
Grades K-8
736 Students

Public
Grades K-8
736 Students
Public
Grades K-8
736 Students
Public
Grades K-8
736 Students
Public
Grades 6-8
510 Students
Public
Grades 6-8
510 Students
Public
Grades 9-12
93 Students
Public
Grades 9-12
2,109 Students

Public
Grades 9-12
2,109 Students
Public
Grades 9-12
1,994 Students
Public
Grades 9-12
1,994 Students
† Our analysis of utilities, groceries, transportation, healthcare, home prices, and other goods and services is sourced from the Cost of Living Index, a respected benchmark published by the Council for Community and Economic Research (C2ER) that provides a thorough overview of living expenses across different regions.
Rent data is provided by CoStar Group’s Market Trend reports. As the industry leader in commercial real estate information, analytics, and news, CoStar conducts extensive research to produce and maintain a comprehensive database of commercial real estate information. We combine this data with public record to provide the most up-to-date rental information available.
Consumer goods, services, and home prices are sourced from the Cost of Living Index published by the Council for Community and Economic Research (C2ER). The data on this page is updated quarterly. It was last published in June 2026.
Demographic information comes from Neustar and combines detailed address data with U.S. Census and American Community Survey statistics to produce reliable local estimates.


