
Estates of McKinney
7200 Welcome Blvd,
McKinney, TX 75071
$1,403 - $4,594
1-4 Beds


McKinney, Texas combines historic architecture with contemporary living just 30 miles north of Dallas. The city's downtown square centers around the McKinney Performing Arts Center, housed in a restored 1875 courthouse that hosts entertainment and community events throughout the year. The 289-acre Heard Natural Science Museum & Wildlife Sanctuary offers 6.5 miles of nature trails and serves as home to native Texas wildlife. The rental market currently shows one-bedroom units averaging $1,413 monthly, reflecting a 1.5% decrease from the previous year, while two-bedroom apartments typically rent for $1,851, down 2.4% year-over-year.
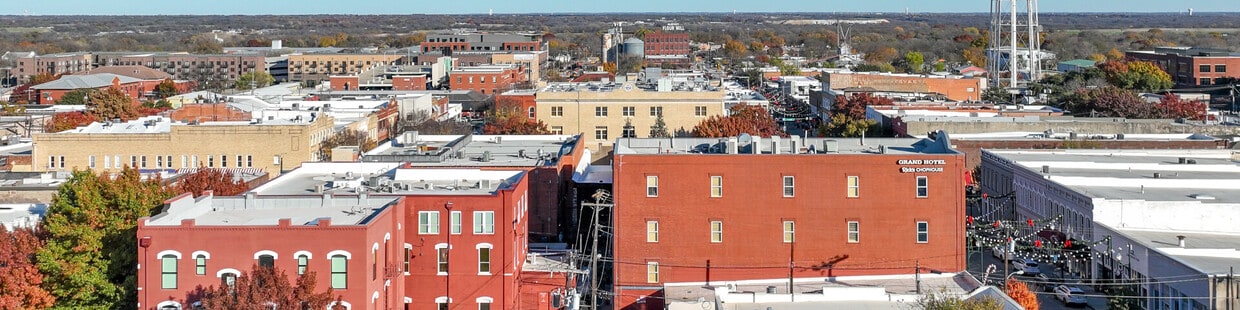
McKinney has grown to become Texas's 15th largest city while preserving its historic character. Neighborhoods range from the downtown historic district, featuring preserved Victorian architecture and local shops, to newer developments near TPC Craig Ranch, which hosts the annual AT&T Byron Nelson golf tournament. The city is served by multiple school districts and includes the Collin College Central Park Campus. Outdoor enthusiasts can explore Erwin Park's 212 acres, including 10 miles of mountain bike trails, while the McKinney Farmers Market at Chestnut Square Historic Village provides locally grown produce and artisanal goods year-round.
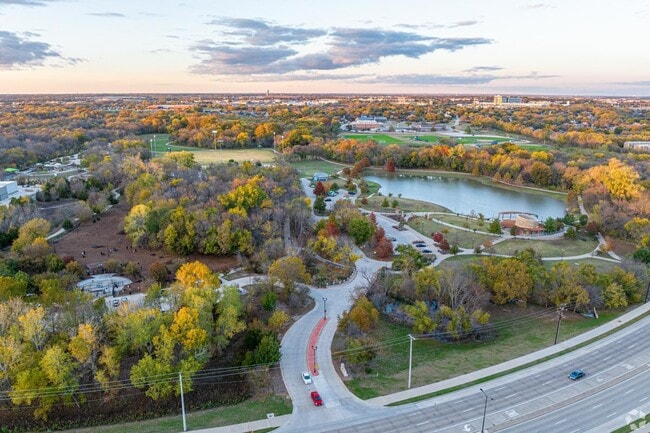
Bonnie Wenk Park is 216 acres and includes many unique features.
While in Historic Downtown McKinney you can stop in for a bite and then do more shopping.
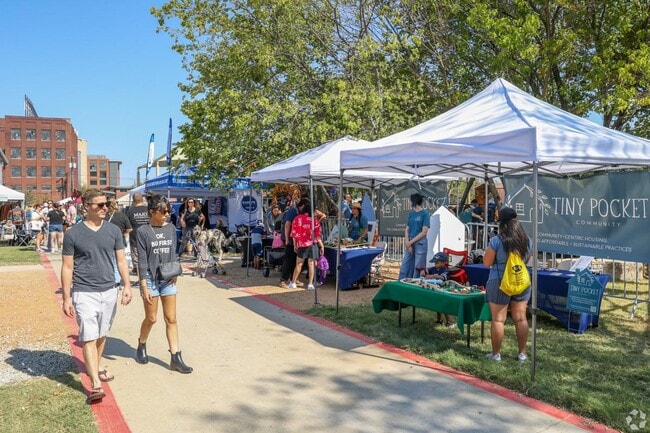
Spend some time shopping for unique gifts at Ratrodtober Fest with your loved ones.
As of March 2026, the average apartment rent in McKinney, TX is $1,098 for a studio, $1,381 for one bedroom, $1,820 for two bedrooms, and $2,405 for three bedrooms. Apartment rent in McKinney has decreased by -3.6% in the past year.
The cost of living in McKinney, TX is 2.9% lower than the national average. Generally, housing in McKinney is 4.6% less expensive than the national average, with rent falling between $1,098 - $2,405. You can expect to pay 2.8% less for groceries, 13.0% more for utilities, and 15.0% less for transportation.
Explore how walkable, bikeable, drivable, and transit-friendly McKinney, TX is for everyday living.
Car-Dependent
This area is considered a car-dependent area and most errands will require a car.
Somewhat Bikeable
You might be able to find places to ride your bike in this area, but you’ll most likely want your car for most errands.
Roy Lee Walker Elementary School
Public
Grades K-5

Public
Grades K-5
Public
Grades K-5
Imagine International Academy Of North Texas
Public
Grades K-12
Public
Grades K-5
Imagine International Academy Of North Texas
Public
Grades K-12
Public
Grades 6-8

Public
Grades 6-8

Public
Grades 6-8
Public
Grades 6-8
Imagine International Academy Of North Texas
Public
Grades K-12
Public
Grades 9-12
Public
Grades 9-12
Public
Grades 9-12

Public
Grades 9-12


3,490
Communities
959,772
Units
895
Cities

347
Communities
103,303
Units
139
Cities

715
Communities
198,674
Units
340
Cities

53
Communities
13,649
Units
27
Cities

16
Communities
6,858
Units
8
Cities

625
Communities
174,401
Units
249
Cities
† Our analysis of utilities, groceries, transportation, healthcare, home prices, and other goods and services is sourced from the Cost of Living Index, a respected benchmark published by the Council for Community and Economic Research (C2ER) that provides a thorough overview of living expenses across different regions.
Rent data is provided by CoStar Group’s Market Trend reports. As the industry leader in commercial real estate information, analytics, and news, CoStar conducts extensive research to produce and maintain a comprehensive database of commercial real estate information. We combine this data with public record to provide the most up-to-date rental information available.
Consumer goods, services, and home prices are sourced from the Cost of Living Index published by the Council for Community and Economic Research (C2ER). The data on this page is updated quarterly. It was last published in February 2026.


