Median Age
27 Years
Largest Age Group
10-19 Years
Approximately 20% of Residents
Under 20
38%
Over 65
7%
Avg Rent
$1,647
Population
85,329
Renter Mix
26% Rent
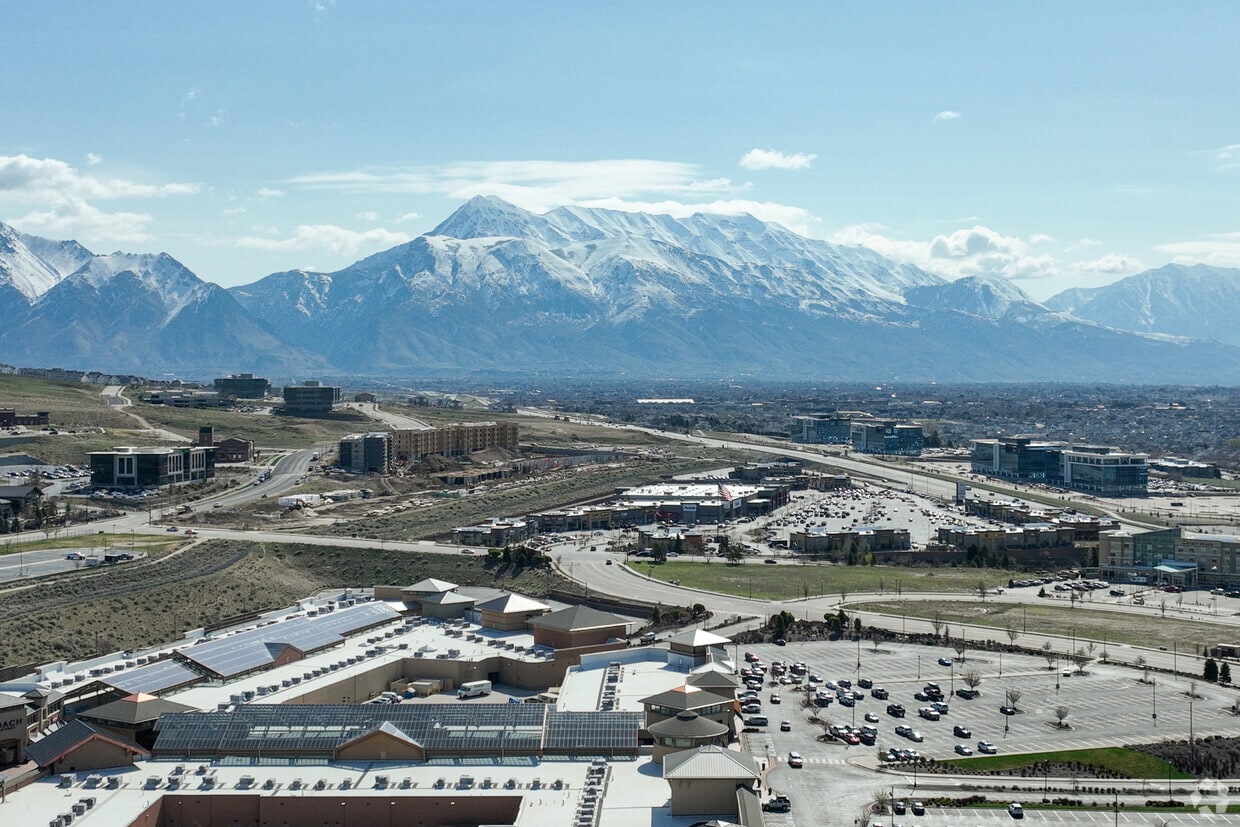
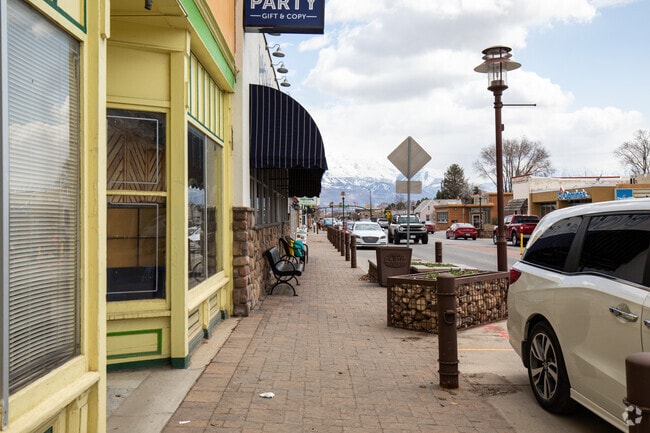
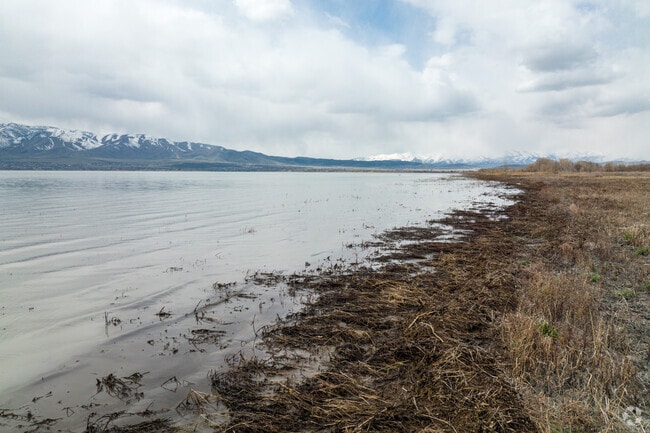
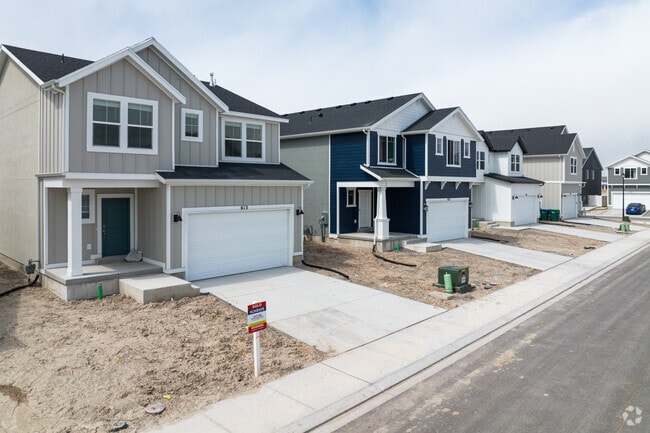
Lehi sits at the northern edge of Utah Valley, about 30 miles south of Salt Lake City along Interstate 15, with the Wasatch Mountains rising sharply to the east and Utah Lake stretching out to the south. Daily life here blends access to wide-open natural space with the energy of a fast-growing tech corridor known as Silicon Slopes. Residents can grab breakfast near the Thanksgiving Point district, take a lunch break trail run, and be at a major tech campus before the afternoon is over. Neighborhoods like Traverse Mountain in the northern hills and the historic downtown core near Main Street give the city a range of personalities, from sweeping mountain views to tree-lined streets with older homes. The rental market in Lehi includes everything from townhomes and garden-style apartment communities to newer mid-rise buildings near the Silicon Slopes corridor. Many communities along the North Thanksgiving Way corridor sit within easy reach of employers, shops, and parks. Utah Valley University in nearby Orem and Brigham Young University in Provo are both within about 20 miles, making Lehi a practical base for students and staff alike. Lehi Round-Up Week, held each June, has been a city tradition for well over a century and includes a rodeo, parade, and a full week of community events.
Explore the Beauty of Utah Lake and its Surrounding Hiking Trails in Lehi
Brand New Homes in Lehi, Perfect for a Small Family
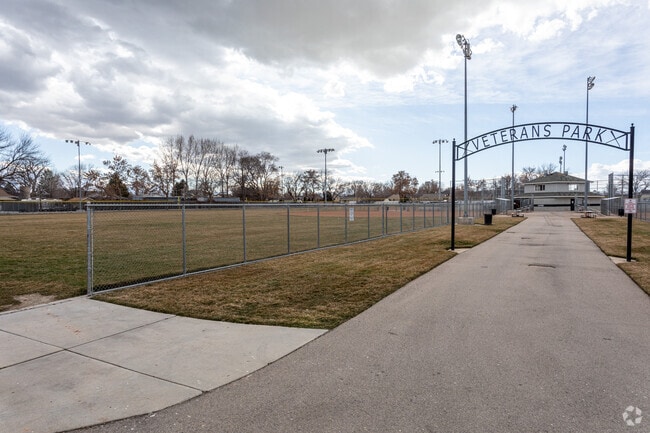
The Lehi neighborhood boats many baseball fields.
Median Household Income
$118,190
Average: $139,772
Education
24,665
Residents Have a Degree
Job Market
43,012
Workers Employed
Median Age
27 Years
Largest Age Group
10-19 Years
Approximately 20% of Residents
Under 20
38%
Over 65
7%
Housing Distribution
Lehi has more homeowners than renters.

Education Distribution
Review this city's overall education levels.

As of July 2026, the average apartment rent in Lehi, UT is $1,324 for a studio, $1,644 for one bedroom, $2,107 for two bedrooms, and $2,339 for three bedrooms. Apartment rent in Lehi has increased by 0.7% in the past year.
Explore how walkable, bikeable, drivable, and transit-friendly Lehi, UT is for everyday living.
Somewhat Walkable
Walkability
Limited Public Transit
Transit
Exceptionally Drivable
Drivability
Fairly Bikeable
Bikeability
Public
Grades PK-5
1,127 Students

Public
Grades PK-5
855 Students

Public
Grades PK-5
776 Students
Public
Grades K-8
742 Students
Public
Grades PK-5
1,128 Students

Public
Grades K-8
742 Students
Public
Grades 6-8
1,376 Students
Public
Grades 6-8
995 Students
Public
Grades K-8
646 Students
Public
Grades 6-8
1,746 Students

Public
Grades 9-12
2,483 Students
Public
Grades 9-12
1,982 Students
Public
Grades 9-12
2,242 Students

† Our analysis of utilities, groceries, transportation, healthcare, home prices, and other goods and services is sourced from the Cost of Living Index, a respected benchmark published by the Council for Community and Economic Research (C2ER) that provides a thorough overview of living expenses across different regions.
Rent data is provided by CoStar Group’s Market Trend reports. As the industry leader in commercial real estate information, analytics, and news, CoStar conducts extensive research to produce and maintain a comprehensive database of commercial real estate information. We combine this data with public record to provide the most up-to-date rental information available.
Consumer goods, services, and home prices are sourced from the Cost of Living Index published by the Council for Community and Economic Research (C2ER). The data on this page is updated quarterly. It was last published in June 2026.
Demographic information comes from Neustar and combines detailed address data with U.S. Census and American Community Survey statistics to produce reliable local estimates.


